Cookie policy

We use cookies to enhance and personalize your experience. If you accept you agree to our full cookie policy. Learn more about our cookies.

 
Cookie settings
  • 120 Product updates
featured-image

February Product Release Highlights

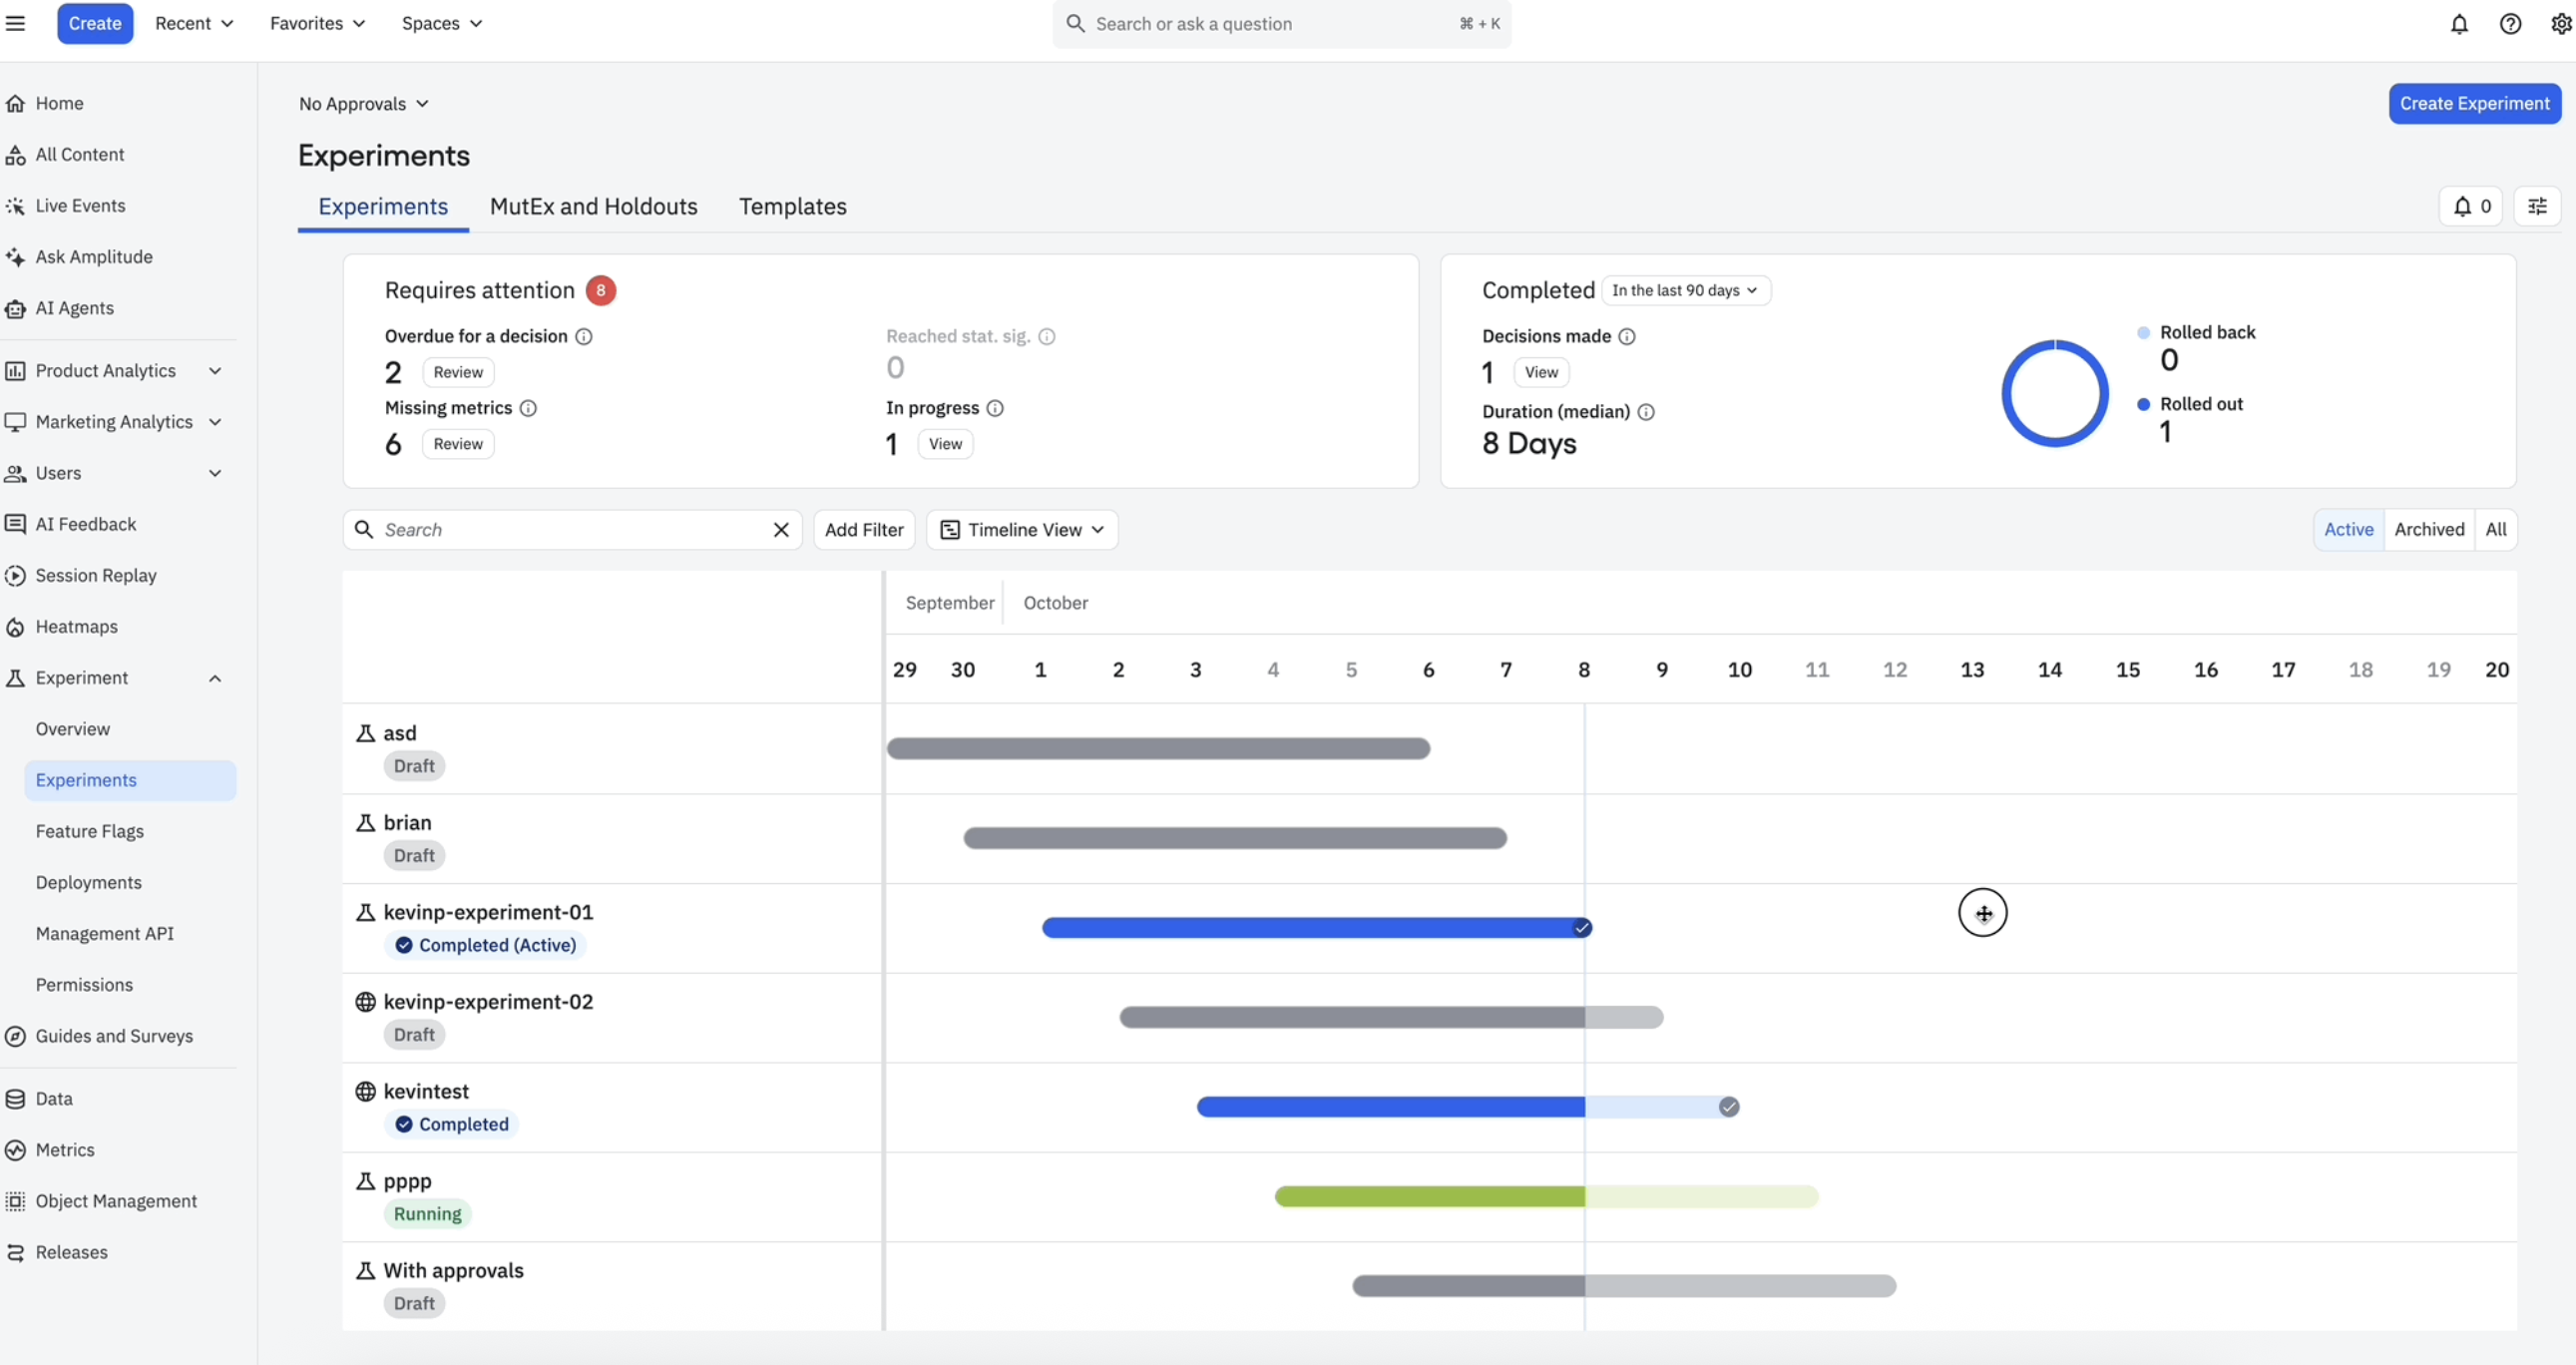
New features to help scale your most important work In February, we released a slew of feature enhancements to give your team even more powerful insights and reliable data, as well as new experimental controls to help your programs scale. Updates are available to all Amplitude customers and in the EU Data Center unless stated otherwise. Summary New Analytics releases New Funnel chart updates General availability of space edit access New Data releases More complex cohort logic with new OR clause capabilities [Beta] General availability of Webhook Event Streaming Analytics SDK and Ampli wrapper for Go Partner integrations for Productboard, Plotline.io, Marketo, and Bento New Experimentation releases CUPED availability Data Quality Checklist Python and Golang SDK New endpoints for the Management API [Beta] Archived experiment improvements New Analytics releases Better funnel insights, easier collaboration Get deeper conversion insights with updated funnel charts Funnel charts are more powerful than ever. Our latest updates make it possible to: Calculate the total revenue attributed to a conversion Apply a conversion window of 90+ days to help businesses with longer funnels get quality insights Access these updates by opening the Funnels Chart in Analytics. Learn more about building a funnel analysis. Space edit access is now generally available Now all Amplitude customers can easily co-create and maintain analyses across charts, dashboards, notebooks, and Cohorts. Space edit access eliminates access issues in situations like: Increasing object ownership to new teams or individuals Providing an existing team with access to multiple objects Maintaining edit access to objects owned by former team members Determine who views, adds, or edits all objects within a Space. When moving charts into a Space, you’ll also see new disclosure badges on content. Access this update from the Share button within team Spaces. Learn more about Amplitude Spaces. New Data releases Unlock new capabilities with cohorts, integrations Use more complex logic to build cohorts with new OR clause capabilities [Beta] You can now use OR statements on top of AND clauses when creating cohorts. This new option lets you more easily create complex segments which satisfy one condition or another. Here’s an example cohort you can build with this new feature: Growth and Enterprise customers can access this feature in the Cohort Builder. Webhook Event Streaming is now generally available Get more granular control over what data you send to the rest of your stack. Webhooks Event Streaming allows you to select which event, user, or group properties to include in the payload of forwarded events. Access this feature by navigating to Data Destinations within the Catalog section of Data. Learn more . Go SDK for Analytics is now generally available Streamline Amplitude data collection in your Go applications with the Go SDK for Analytics. It comes with Ampli wrapper and has full feature parity with other next-generation SDKs, including custom plugin support. Access this feature by navigating to SDK sources in the Catalog section of Data. Learn more about Analytics SDK and Ampli Wrapper . Enjoy integrations with Productboard, Plotline.io, Marketo, and Bento [Beta] Access these integrations from Data Sources within the Catalog section of Data. Unless specified, these integrations are only available to paid users and not in the EU Data Center. Productboard cohort sync - Productboard users now have additional identity mapping options, including User_IDs, emails, and External IDs. This update helps match and resolve user identities using the highest quality data possible. Learn more about the Productboard cohort sync . Plotline.io cohort sync - Plotline.io users can activate more users and personalize onboarding flows by sending Amplitude cohorts to Plotline. Learn more about t he Plotline.io cohort sync . Marketo list cohort sync - Marketo users can export Amplitude cohorts into Marketo as a static list and then send them to any destination folder or program. Learn more about the M arketo list cohort sync . Import Bento Events - Bento users can now send events to Amplitude for a better understanding of how engagement with guides impacts activation. NOTE: This feature is available to all users. Learn more about importing Bento events. New Experimentation releases Reliability, scalability, organization enhancements Generate more reliable experiment results with CUPED Teams can now use CUPED (Controlled-experiment Using Pre-Existing Data) methodology to analyze A/B test results in Experiment. In traditional A/B testing, teams get the average treatment effect by comparing the average outcomes of a treatment group to a control group. This assumes the treatment effect is the same for all individuals, which isn’t always true in practice. CUPED addresses this limitation by estimating the treatment effect separately for each individual and then aggregating the individual estimates to get an overall assessment of the treatment effect. Access this feature by toggling CUPED ‘On’ in the Statistical Settings section of the Analyze tab. Learn more about CUPED availability . Follow experimentation best practices with Data Quality Checklist Feel more confident setting up and running your tests–especially as you scale. With our new Data Quality Checklist, Experiment runs a series of automated data quality checks to uncover potential issues that could skew your results. Get the next steps for fixing these issues with sample ratio mismatches, variant jumping, or exposures without assignments. Access this feature in the Analyze tab. You’ll also be alerted proactively with our automated notifications. Python and Golang SDKs now available for Amplitude Experiment Developers working with Experiment now have two new SDKs generally available to help them better support their test programs: Python and Golang. Both SDKs support Remote and Local evaluation. Access this feature in the Amplitude Development Center. Learn more about Python SDK and Golang SDK . Automate QA with new endpoints in Management API [Beta] We’re releasing functionality for the Experiment Management API that allows customers to leverage new auditing capabilities. The enhancements offer updated endpoints for both feature flags and experiments, including new Variants, Variant users, Edit flag/experiment, and Get experiment version details. Customers can request to try out an early version of the API in the Amplitude Developer Center. Organize and restore experiments easily with new Archive capabilities Archiving improvements are here! As customers scale their experimentation programs, one of the top requests we hear is for better organization tools. Now you can review, search, and restore old tests in one view. Click into archived flags and experiments for a read-only view of configuration and data. Restore items if you wish to make new changes. Search and sort for archived experiments and flags on the Experiment homepage. That’s a wrap! Here’s what’s next: Sign in to your Amplitude account to start using these new features. (Need an account? Start using Amplitude for free.) Subscribe to product updates from our Community to stay up-to-date with the latest releases. Let us know which update you’ve been waiting for in the comments.

Related products:Product AnalyticsData ManagementCollaborationExperiment
featured-image

January Product Release Highlights

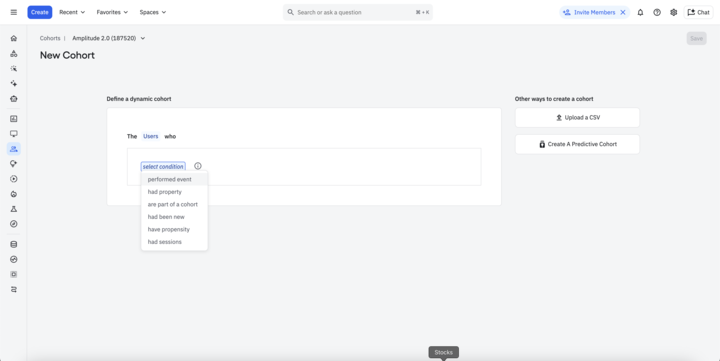
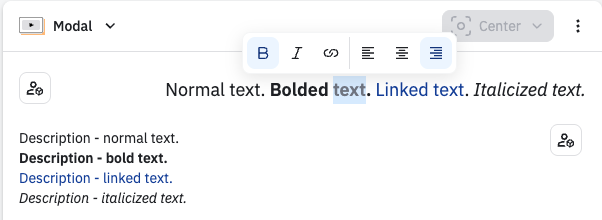
Powerful enhancements to help you grow in 2023 Start the year strong with our latest product releases. New collaboration capabilities and improved experiences help you work more effectively. Plus, we’ve added several integrations so your team can collect and analyze data from more sources. Updates are available to all Amplitude customers and in the EU Data Center unless stated otherwise. Summary New Analytics releases Monthly tracked user (MTU) pricing model Pivot view in Data Tables General availability of rich text editing in Notebooks Updated dashboards grid experience Save chart modal Edit access for Team Spaces [Beta] Public links in Data Tables, Notebooks, and dashboards Custom Events in Pathfinder New Data releases New partner Integrations [Beta] New Portfolio experience Support for multiple environments Source Configuration updates New Experimentation releases Summary cards New Analytics releases Experience enhancements for your whole team Get unlimited events up to 1 million monthly tracked users (MTUs) We’ve introduced an MTU model across our subscription plans. We shifted from event-based pricing because we found it wasn’t ideal for customers earlier in their analytics journey. Customers who grow past 1 million MTUs can switch to an event-based plan or a more customized MTU model. If you’re on an MTU plan, you can view usage statistics by navigating to General under the Organizational settings menu. MTU metrics will be visible in their own panel. Learn more about our new pricing model. Create customized reports with the new pivot view in Data Tables It’s easier than ever to do multi-dimensional analysis in Data Tables. With the new pivot view, you can flip rows and columns to meet specific reporting needs and export to share. Access the pivot view by selecting Rows from the Columns dropdown. This will flip the axes. This release is only available to Plus, Growth, and Enterprise customers. Learn more about multi-dimensional analysis in Data Tables. Rich text editing in Notebooks is generally available The highly-requested new formatting toolbar in Notebooks is now available to all Amplitude customers. The rich text editor expands your formatting options and helps you save time with common keyboard shortcuts and markdown inputs. Edit dashboards more easily with the updated user experience We’ve overhauled the dashboard grid system so you can make edits in fewer clicks. No longer hidden within menus, the new experience includes draggable resizing and the ability to move charts to clear drop points. Access grid content directly within a dashboard in Analytics. Create a new report from the save chart modal It used to be that, when saving a chart, you could only add it to existing dashboards and Notebooks. Now you can create new reports in the same modal you used to save the chart. Access this update from the Add to Report dropdown in the Save modal on a chart. Collaborate more effectively with edit access for Team Spaces [Beta] We’re releasing Spaces edit access so teams can co-create and maintain analyses across charts, dashboards, Notebooks, and cohorts. This update keeps access issues from slowing down collaboration in situations like: Scaling object ownership to new teams or individuals Providing an existing team with access to multiple objects Maintaining edit access to objects owned by former team members You determine whether team members can view, add, or edit all objects within a space. You’ll also see new disclosure badges on content when attempting to move charts into a space. Beta customers can access this update from the Share button within Team Spaces. These updates are not currently available in the EU Data Center. Learn more about Amplitude Spaces . Use new public links to make analyses and reporting available to anyone You can now make your published Data Tables, Notebooks, and dashboards viewable to anyone outside your organization–without special permissions or requiring them to log in. Access this update from the Share button at the top right corner of your Data Tables, Notebooks, and dashboards. This release is only available to Plus, Growth, and Enterprise customers. Better understand customer journeys with Custom Events in Pathfinder Get greater control over how your custom events are grouped for easier analysis. View custom events at every step of your customer’s journey in Pathfinder. Analytics users can enable Custom Events from the Filter Events dropdown in a Pathfinder chart. Learn more about Custom Events in Pathfinder . New Data releases A slew of new integrations, improved support Enjoy integrations with Sprig, Insider, Maze, Extole, Kameleoon , and Toplyne [Beta] Access all integrations from Data Sources within the Catalog section of Amplitude Data. These updates are not currently available in the EU Data Center. Import Sprig Events - Sprig users can now push survey data directly into Amplitude when creating charts and cohorts to better understand the relationship between customer satisfaction and product usage. Learn more about importing Sprig Events . Import Insider Events - Insider users can now send data like email opens or SMS clicks directly into Amplitude to create charts and cohorts. Learn more about importing Insider Events . Maze Cohort Sync - Maze users can now create more personalized campaigns by sending custom audiences from Amplitude directly into the platform. This release is only available to paid customers. Learn more about the Maze Cohort Sync . Extole Event Streaming - Extole users can now enhance their campaigns with Amplitude events and view them in real time with Extole’s Event Live View. Once connected, Amplitude events can be used to trigger emails, fulfill rewards, create audiences, and track user activity within the Extole platform. Learn more about Extole Event Streaming . Kameleoon Event Streaming - Kameleoon users can now leverage real-time Amplitude events to supercharge campaigns, enhance targeting, and re-implement Amplitude tracking plans within the Kameleoon platform. Learn more about Kameleoon Event Streaming . Toplyne Event Streaming - Toplyne users can now identify opportunities for free-to-paid conversion and enterprise expansion in their existing GTM tools. They can also engage with and nurture accounts to take them to the next step of product adoption. Learn more about Toplyne Event Streaming . Get instant access to the new Portfolio experience Amplitude Data now supports Portfolio projects. We’ve rebuilt the taxonomy and made several other highly-requested improvements, including: Passing event and property metadata from source projects to the Portfolio automatically (while still allowing customizations when necessary) Providing faster performance for large Portfolio projects Any Data customers with the Portfolio add-on get immediate access to the new experience when they open a Portfolio project. Optimize your workspace with support for multiple environments You can now add, rename, and reorder up to five environments in a workspace to design a setup in Data that matches your release workflow. Previously, you could only have “Production” and “Development” environments. Access this update in the Environment Settings page in Data. Speed your tracking process with updated Source Configuration We’ve updated the Source creation and configuration process for Data Governors. These updates make it easier to quickly create Sources and start using them in planning without needing to determine technical implementation details ahead of time. We used to require Data Governors to select a programming language and SDK version for source creation. Now they only need to name a Source in the Data to use it in a tracking plan. This release also includes significant documentation updates, including new quickstarts for all Ampli SDKs in the Dev Center and improved in-app implementation instructions in Source settings. Access these updates from the Catalog page in the Connections section of the Data sidebar. Learn more about Source Configuration and the Implementation page . New Experimentation releases Understand and share Experiment learnings quickly with Summary cards We added two new Summary cards to the homepage so you can see at-a-glance which experiments are complete or need your attention. The cards also provide a high-level view of your team’s experiment velocity. You’re all caught up! Here’s what to do next: Sign in to your Amplitude account to start using these new features. (Need an account? Start using Amplitude for free.) Subscribe to product updates from our Community to stay up-to-date with the latest releases. Let us know which update you’ve been waiting for in the comments.

Related products:Product AnalyticsData ManagementCollaborationExperimentAudiences
featured-image

December Product Release Highlights

New features set you and your team up for success In December, we shipped enhancements that make features such as Data Tables and Analytics integrations more powerful and easy to use. We also released new experiences like Data Home and integrated help in Experiment to surface critical information when you need it, right in Amplitude. Updates are available to all Amplitude customers and in the EU Data Center unless specified. Summary New Analytics releases Universal navigation updates Data tables enhancement Increased timeframes for Pathfinder Daily custom alerts for Growth Plans Rich text editing in Notebooks [Beta] Unfurling improvements in Slack and Notion New Data releases Amplitude Data migration updates New Data Home New Node.js, iOs 3.0, Ruby 1.0 SDKs Google Tag Manager template for Marketing Analytics Browser SDK New Experimentation releases Integrated help New Analytics releases Enhancements to recent releases Access important information more easily with updates to universal navigation Last month, we announced a new user experience that makes it easier to get started in Amplitude, improves collaboration, and helps teams unlock value faster. We’ve made additional updates: With the new Help icon, the Amplitude Community, Help Center, and Digital Customer Success team chat are one click away. Persistent object headers and toolbars across charts, dashboards, and notebooks offer helpful background information and make it easy to share your insights. Manage key information about your projects in one place. Releases have moved and now live under Settings > Projects on the bar beside Annotations. These updates are not available in the EU Data Center. In case you missed what changed in our new navigation, check out this video: Learn more about new universal navigation. Summarize large amounts of data with an update to Data Tables Data tables make multi-dimensional analysis possible right within Amplitude. Now you can analyze data right away when you export data tables to CSV by removing overall rows and making it so group by columns are no longer concatenated. Access this update within the Data Tables experience. Analyze user behavior over longer timeframes in Pathfinder We’ve increased the timeframe for Pathfinder from 30 to 45 days so you can analyze how users move through your product or website over longer periods of time. Access timeframe options from the top right-hand corner of the Pathfinder experience. This release is only available to Growth and Enterprise customers. Access daily custom alerts in your Growth Plan If you have a Growth Plan, you now get Daily custom alerts. Select the conditions under which you want to receive a custom alert. You can also set an alert based on confidence interval. Choose whether to send your custom alerts as email notifications to designated members of your team so they can take action. You can set a custom alert for any saved chart. Navigate to the chart for which you want to set an alert, then click the bell icon to open the quick set-up tool and create a custom alert. Learn more about daily custom alerts in Growth Plans . Edit Notebooks more easily with formatting enhancements [Beta] The new formatting toolbar makes it easier than ever to apply styling to your text. Save time composing notes with supported common keyboard shortcuts and markdown inputs. If you’re not seeing this experience yet for new notebooks you create, don’t fret! Keep your eyes on future Community posts where we’ll announce general availability soon. This update is not currently available in the EU Data Center. It will be available in EU Data Center when the update becomes generally available. Unfurling improvements in Slack and Notion Now you can paste Amplitude breadcrumb chart links and Amplitude chart edit links on Slack and Notion. Unfurl the charts to show a preview of the chart title, owner, duration, and an image of the chart. You’ll see this update when you paste a breadcrumb chart link to Slack or Notion. These updates are not available in the EU Data Center. New Data releases Simpler processes, easier access to information Enjoy simplified event property management in Data On the Properties page, you now have the power to set the property definition/rules across your schema or customize properties as “overrides” in the context of an event. If you are a customer with an Accounts Add-On, you can also plan groups and group properties as well as delete groups and modify group property visibility, all in Data. Get a snapshot of the quality of tracked data with Data Home We’re excited to introduce Data Home, a new landing page experience for Data customers. This new page helps data governors understand how their data is managed within Amplitude at-a-glance, including: Quality of tracked data in their tracking plan Which instrumented events power their teams’ insights How events track against event volume They can also quickly access documentation and Amplitude Academy courses to help them proactively manage their data. Start using new software development kits (SDKs) In the last month, we’ve released three new SDKs to support your work: Node.js SDK iOS 3.0 SDK (beta) Ruby 1.0 SDK These next-generation SDKs improve code readability, make it easier for users to inspect source code, and speed up development cycles by reducing time for addressing issues. New Google Tag Manager template for Marketing Analytics Browser SDK We released a Client Side Google Tag Manager template for the new SDK. The tag collects data with the Amplitude Marketing Analytics Browser SDK. Access the tag manager template from the Google Tag Manager Template Gallery. Learn more about the Marketing Analytics Browser SDK template in the Google Tag Manager . New Experimentation releases Better in-product support, when you need it Get help when you need it, integrated in-app Now, with integrated help, you get instant access to deeper information across every component of Amplitude Experiment to help you take the best next step, faster. Integrated help offers a brief overview of each component, and links you directly to relevant help center articles, developer documentation, and other resources. Get started using these releases today Sign in to your Amplitude account to start using these updates today. (Curious about Amplitude but not yet a customer? Try the demo.) Subscribe to product updates from our Community to get the latest release highlights delivered to your inbox. Let us know which updates you’re most excited about in the comments.

Related products:Product AnalyticsData ManagementExperiment
featured-image

November 2022 Product Release Highlights

New features make Amplitude more powerful and easy to use While we’re nearing the end of 2022, our Product Team shows no signs of slowing down! Last month we shipped 16 new features and experience improvements to help you get more value out of Amplitude with fewer clicks. Updates are available to all Amplitude customers and in the EU Data Center unless specified. Summary New Analytics releases Campaign reporting tools New navigation [Open Beta] Create, save, and manage Metrics [Open Beta] Object Management Center Pathfinder improvements Session Metrics New Data releases Data General Availability Accounts Add-On Usability improvements New Experimentation releases EU Data Center availability New experiment types Seamless lifecycle management Statistical significance data on the homepage Duration estimates Uplift notifications New Analytics releases More reporting tools, new experiences Understand how acquisition spend drives product growth with campaign reporting tools Last month, we announced the open beta of new campaign reporting tools. We’re excited to share that the following features are now generally available to all Growth and Enterprise customers: Acquisition Channels - Identify where acquisition traffic comes from alongside your other performance measurements. You can also create rules that use existing properties and property values to automatically classify the channel used to source respective events in your product. Read more about Acquisition Channels. Access this new feature from the Govern Console. Multi-Touch Attribution - Distribute credit for your marketing programs easily using pre-built attribution models that you can configure on your metric. You can also create a custom model. Read more about Multi-Touch Attribution. Unlike other solutions, Amplitude enables unlimited look-back windows on attribution. By combining product and acquisition data, you can attribute product usage by acquisition source and see how product features or content impact product success events. Access this new feature in Data Tables. Combining Acquisition Channels and Multi-Touch Attribution lets you understand how your channels impact bottom-line product outcomes, such as which channels bring in power users, drive conversion, and retain users over time. Ad-Network integrations - More easily measure how ad campaigns perform. By integrating campaign data such as cost, impressions, and clicks, you can unlock new insights into overall campaign performance and return on investment. Read more about Ad-Network integrations. Access this feature with Google and Facebook via their Data Sources page. Learn more about Campaign Reporting. Unlock the value of Amplitude even faster with our new navigation [Open Beta] Our improved navigation user interface (UI) makes it easier than ever to get started in Amplitude. Here’s what’s new: Universal navigation bar - Access key actions such as “Create new,” “Access home,” “View recent,” “Spaces,” and “Cohorts” in one place at the top of your screen. Favorites improvements - Now, you can unfavorite objects in bulk and drag and drop favorites to you can keep them in your preferred order. Cohorts have joined reports, dashboards, and notebooks as items you can favorite. Updated search prioritization logic - See the most popular content in your organization at the top of the list when you search. This Open Beta is not available in the EU Data Center. Learn more about new navigation. Create and save core metrics for your product, marketing, and growth teams to reference [Open Beta] Now, you can build and save reusable formulas, called Metrics, throughout the Amplitude interface. Project administrators can verify metrics to standardized for reuse across different analyses and your entire organization. Access this feature within event segmentation by clicking the dropdown. You’ll see the option to select events or metrics. This Open Beta is available for Growth and Enterprise customers. Learn more about creating, saving, and managing metrics . Enjoy a one-stop shop for managing analysis objects with the Object Management Center Reduce clutter and increase confidence for end users when building analyses by managing analysis objects such as custom events, metrics, segmentation, and cohorts in one place. Now when you create an analysis, you can view similar objects to reduce duplication and officiate objects. Once you’ve created your analysis, you can view metadata, search for and edit existing objects, and jumpstart analyses from the object itself. Access the Object Management Center from the left navigation panel. Or, if you’re in the new navigation UI open beta, click on the square icon next to the bell icon in the top right corner of the navigation panel. This feature is available to Enterprise customers. Learn more about the Object Management Center. Save time and improve the accuracy of your analyses with Pathfinder improvements You can now exclude specific events by specific property values. When you have certain events you want to see, you can include only those events instead of manually excluding all irrelevant ones. This makes insights from your analysis more actionable. Access this feature within Pathfinder by clicking “Hide or show events.” Access Session Metrics in Data Tables and Event Segmentation Charts Session Metrics such as bounce rate or exit rate are now available in Data Tables and Event Segmentation Charts. Session metrics are helpful diagnostic tools for obtaining a deeper understanding of how campaigns or content items perform. Access Session Metrics options by adding a Metric to a Data Table. Toggle from the “Events” tab to the “Metrics” tab, then expand the session section and select your desired metric. This feature is available to Growth and Enterprise customers. Learn more about Session Metrics . New Data releases Generally available features, new self-serve migration options Amplitude Data is now Generally Available We are excited to announce the General Availability (GA) of Data, a unified data management console that combines features with Govern, Sources, and Destinations into one interface. Learn more about what’s new. Access all the new features of Amplitude Data for customers using Accounts Add-On Customers using Accounts Add-On now get access to Data features such as collaborative planning capabilities, observability features to monitor data quality, and new developer tools that help instrument your events correctly from the beginning. Collaborate on and govern event data more easily with usability improvements As part of making Data generally available, we improved usability across several features, including how you manage properties with event-level property overrides and the ability to configure multiple environments that you can manage with a single tracking plan. These updates help improve trust in the data for end users building analyses. New Experimentation releases Better visibility, better experiments Amplitude Experiment is now available in the EU Data Center Experiment customers in the EU can now easily align their experimentation program with local data privacy standards. By combining EU Data Center availability with enterprise-ready security certifications like ISO 27001 and SOC 2 Type II, EU-based Experiment customers can feel confident that their customers’ data is fully protected and adheres to local regulations. Create better experiments by defining the experiment type Now, you can easily define your experiment as a “Hypothesis Test” or a “Do No Harm” experiment during the planning phase to clarify your next best actions after the experiment ends. When starting an experiment, select a “Hypothesis Test” to run experiments that tests the impact on conversion rate metrics or a “Do No Harm” experiment that ensures any significant changes to your experience don’t hurt more critical business metrics. Better understand the status of your experiments with seamless lifecycle management Understanding the status of every flag and experiment fast is critical to delivering experimentation at scale. New columns identify the primary metric, progress, and last modified date for all your experiments. Filter by eight different aspects, including status, decision, primary metric, and more, to check in on specific tests. Make decisions faster with statistical significance information right on your homepage You can now see the following statistical significance (“statsig”) metrics on the Experiment homepage: Which experiments have reached statsig The time it will take for each active experiment to reach statsig The relative performance of each variant Identify if an experiment won’t reach statistical significance with duration estimates Avoid setting up experiments that will never reach statsig. New duration estimates alert you if you need to redesign your experiment to have enough exposures to achieve statsig. Identify suspicious results quickly with new uplift notifications If you tweak an experiment and start seeing dramatic results, there’s likely an issue. Don’t make decisions based on bad data. New notifications automatically detect and alert you of a suspicious uplift so you can quickly spot and fix potential issues. You’re moments away from getting started with these updates Sign in to your Amplitude account to start using these updates today. (Curious about Amplitude but not yet a customer? Try the demo.) Subscribe to product updates from our Community to get the latest release highlights delivered to your inbox. Let us know which updates you’re most excited about in the comments.

Related products:Product AnalyticsData ManagementExperiment

Amplitude Data is Generally Available

Earlier this year, we introduced a beta version of Amplitude Data — a central hub for data management in Amplitude that combines Govern, Sources, and Destinations with new planning and data observability features. We've been incorporating your feedback and improving performance. Today, we are excited to announce that we're removing the Beta label and making Amplitude Data generally available! In case you're new to Amplitude Data, the new experience improves your ability to: Plan : Leave outdated spreadsheets and one-off Confluence pages behind, and use an always up-to-date tracking plan you can evolve with your team. You can proactively plan events and properties directly in Amplitude during development and instrument events accurately from the get-go. Verify : New observability features let you monitor incoming data and immediately identify issues. You'll be able to verify incoming data against your tracking plan and identify potential problems to help you improve your data quality. Collaborate : With branches, you can have a working copy of your tracking plan you can develop with your team. No need for v2/v3/v4 versions of a spreadsheet — you can iterate with your team in a branch, then merge once you're ready. You can also ensure your team is up-to-speed with commenting support and Slack notifications. Enterprise and Govern Add-on customers also have access to advanced data management features in Amplitude Data, including transformations that help clean up your data and derived properties that let you use formulas to create new properties retroactively. Customers with the Accounts add-on will also be able to move to the new experience soon. The Accounts add-on allows you to perform analyses by custom groups (for example, by companies instead of by individual users). Amplitude Data provides additional capabilities to plan and manage these group types and properties. Over the coming weeks, we're also adding support for Portfolio and working on a new version of the Taxonomy API. Check out the Amplitude Academy Course to see Amplitude Data in action, find more details in our help documentation , and stay tuned to get your migration notification in your email with more information about the new experience.

Related products:Data Management
featured-image

Create, save and manage Metrics in Amplitude

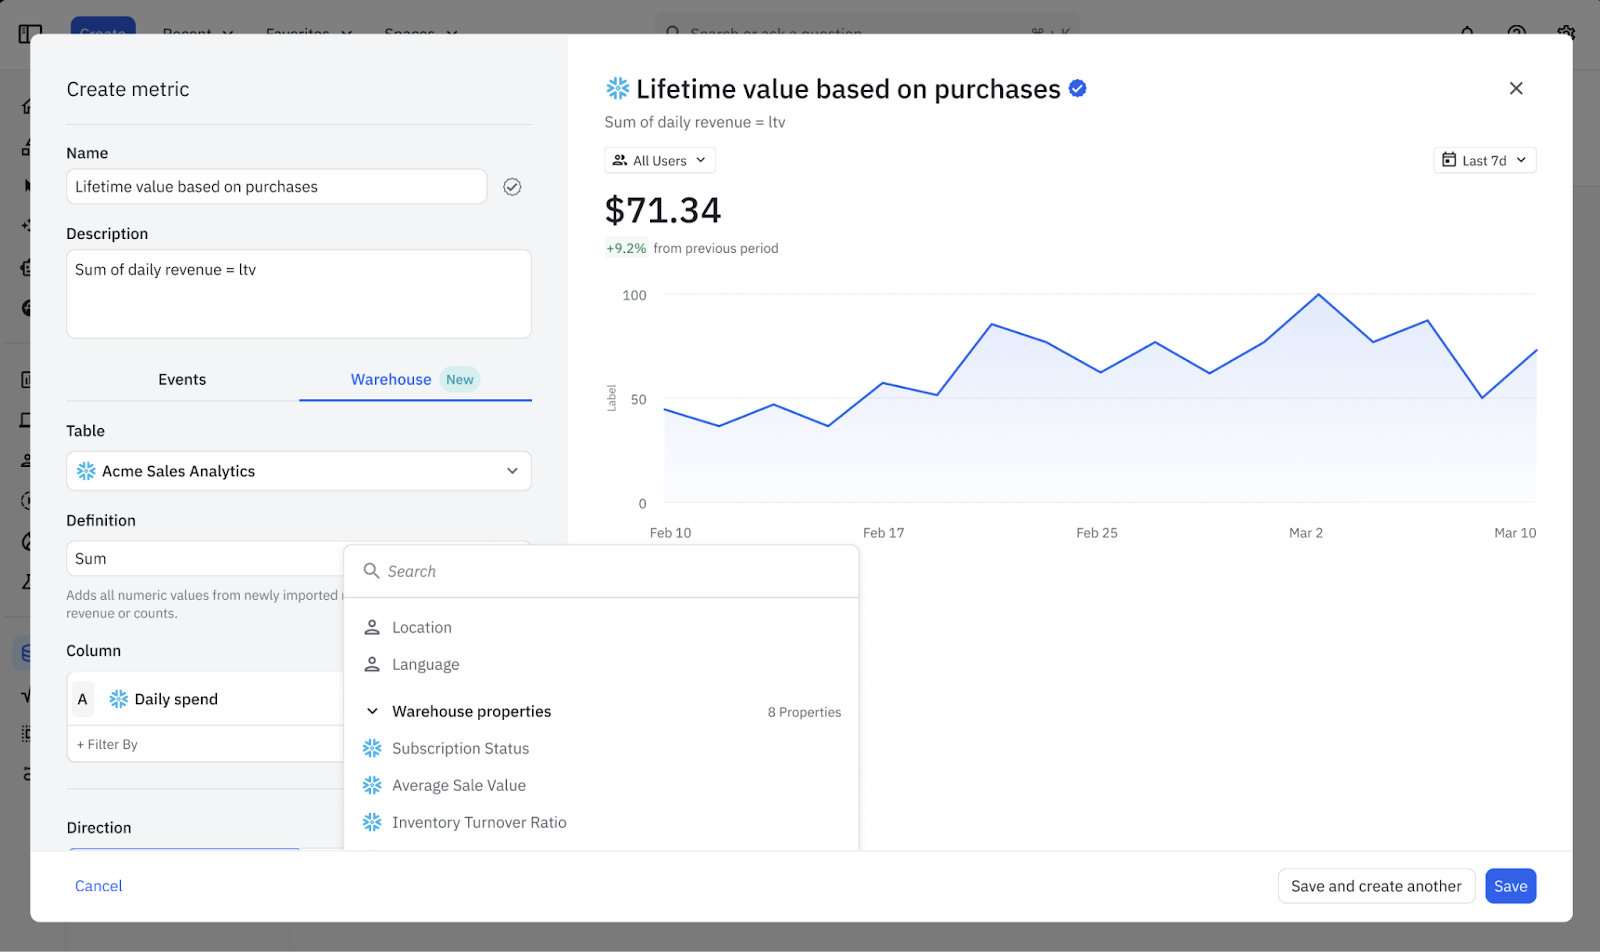
Back at Amplify, we announced new ways to create, save and re-use Metrics in Amplitude. We’re excited to share this update as a new open beta release for Growth and Enterprise plan customers! Here are a few examples of what teams can do with Metrics in Amplitude: A media company that cares about subscribers can now easily define a metric to track how landing pages lead to subscription outcomes An e-commerce business that needs to understand the impact of product behaviors on checkout completion now has a single source of truth A mobile gaming company can define key revenue metrics, such as average subscription value or revenue per user, that product, growth, and marketing can use to grow their subscription business A marketing team can now use our new Ad-Network integrations to bring in campaign spend data and create custom ad metrics directly in Amplitude You can now define and save Metrics as reusable analysis objects in Amplitude. Learn more here. Metrics are shared project-wide and can be created by any member, project manager, or admin. However, only project managers and admins can designate a Metric as official. Additionally, customers on our Enterprise plans now also have access to our new Object Management Center. Object Management in Amplitude provides users with a one-stop shop for centrally managing analysis objects including the ability to govern and curate your Metrics alongside other analysis objects in Amplitude including cohorts, segments, and even custom events! We’re excited to bring these new updates for customers looking to standardize your team’s reporting around your most important product metrics in Amplitude!

Meet our new navigation

We’re excited to share new navigation and usability improvements to Data and Analytics. Highlights of the new UI include: New universal navigation bar Improved search prioritization logic Introducing Favorites, a new feature that allows you to star reports, dashboards, notebooks, charts, and cohorts New object toolbar & headers Amplitude is the #1 Digital Analytics Platform that provides self-service insights for product teams in order to build data-driven products. As we continue to invest in this mission, we want to (1) make it even easier for anyone to get started with Amplitude, (2) design for improved collaboration experiences, and (3) help teams unlock value faster To improve on this vision, we're introducing a set of new improvements to our navigation and usability experience. New universal navigation bar Centralized key actions you can take in Amplitude are now located across the top bar to keep everything–create new, access home, view recents, spaces, and cohorts–in one spot across the top of your screen. Improved search prioritization logic We’re excited to share new search prioritization logic that orders results by the most popular content in your organization. We've heard the need from users to have search be more comprehensive and are planning on including the likes of help content and other results in search. Our Favorite improvements The days of removing starred reports via the dropdown clicking into every object are in the past. Now, you can quickly un-favorite, basically in bulk. Keep your favorites in your preferred order - now you can drag and drop them into whatever order you want. Finally, we’re happy to share that charts and cohorts have joined reports, dashboards, and notebooks as items that can be favorited! Creating an intuitive and best-in-class customer experience is a top priority for us. Stay tuned for more exciting updates! We’re always looking for feedback on how to improve the usability of Amplitude, so let us know what you think.

Related products:Product Analytics
featured-image

October 2022 Product Release Highlights: New features to better understand and engage your users

Another month, another slew of product releases in Amplitude! We’re excited to share new features that help you better understand how your users behave and quickly build cohorts to engage them. Of course, we also made product experience updates across the board so getting stuff done in Amplitude continues to be a breeze. Updates are available to all Amplitude customers and in the EU Data Center unless otherwise specified. Summary Analytics improvements Cart Analysis [Open beta] Atlassian Smart Links Campaign reporting features [Open beta] Marketing Analytics Browser SDK Access disclosure badges Sequential cohorts Interactive cohort preview Updated model for predictive cohorts Data improvements Enhanced observe experience Image support Data migration [Coming soon] Analytics improvements More ways for more teams to use customer data Uncover insights about customer transactions to better understand purchase behavior with Cart Analysis [Open beta] Cart Analysis helps you move your ecommerce business forward. Powered by object arrays, this feature helps uncover new insights about customer transactions and better understand purchase behavior. Get answers to critical questions about which product categories perform best, how different products convert through the checkout funnel, and more. Enterprise customers can start using the feature today within their event segmentation and funnels chart by accessing the product array. Learn more about cart analysis . Bring Amplitude analysis to your team collaboration tools with Atlassian Smart Links Collaborate on product development all in one place with analysis alongside project timelines and actions. With the Atlassian integration, you can quickly organize Amplitude analysis workflows with smart links across apps like Confluence, Jira, and Trello. This feature is not currently available in the EU Data Center. Learn more about Atlassian Smart Links . Better measure marketing impact with new campaign reporting features [Open Beta] Two new features in Analytics make it easier to understand the impact of your acquisition investments across channels: Acquisition Channels - Identify where your acquisition traffic is coming from alongside your other performance measurements. Create rules that use existing properties and property values to automatically classify the channel used to source events in your products. You can access this new feature in the Govern Console. Multi-Touch Attribution - Easily distribute credit for your marketing programs using pre-built or custom attribution models configured on your metric. You can access this new feature in Data Tables. Combining Acquisition Channels and Multi-Touch Attribution lets you understand how your channels impact bottom-line product outcomes, such as which features drive conversion and how your channels retain over time. Growth and Enterprise customers can start using these features today as part of the open beta. Learn more about new campaign reporting features. Unlock automatic web attribution and more with Marketing Analytics Browser SDK The Marketing Analytics Browser Software Development Kit (SDK) extends the Typescript Browser SDK with automatic web attribution and page view tracking. With automatic page tracking, a marketing team can start instrumenting their website without developer support. Plus, settings improvements in the SDK make it easier than ever to get started with marketing analytics. Learn more about the Marketing Analytics Browser SDK . New cohort enhancements Enjoy more flexibility in cohort creation and management with sequential cohorts Build and edit cohorts based on a step in the user flow (ex. create account) directly from the cohorts builder in Analytics and Audiences. Now, there’s no requirement to start with a funnel chart and create the cohort through microscope. Get a dynamic view into membership with interactive cohort preview Interactive Cohort Preview gives you instant feedback as you build and edit cohorts. Before this release, you’d need to build a cohort, save it, then inspect it for accuracy. Now you can spot errors before saving your cohort, so you can make it more precise in less time. Start using this new feature in the Cohort builder in Analytics and Audiences today. Enjoy improved model accuracy and quality with an updated predictive cohorts model Predictive cohorts now include a self-attention-based sequence machine learning model to better harness the power of deep learning. All Audiences customers with the Models package now have access to this updated model. However, this feature is not available in the EU Data Center at this time. Data improvements Improved data management Debug data issues more efficiently with an enhanced observe experience We’ve introduced a new “Issues” column on the Events page to help you identify and address any problems with your data. In the future, you’ll be able to filter events based on the issue types identified. Add images to entity descriptions You can now add multiple images to nearly any entity with a description in Data, including any comments. Amplitude hosts all images. Enjoy an improved data migration experience [Coming soon] We’re testing a new experience for managing event data in Amplitude. If you started using Amplitude this year, you might already be using it! We’re excited to migrate all Amplitude users to this new experience over the coming weeks and months. You’ll be on a unified console where you can access new proactive planning capabilities, developer tooling, and data observability at no additional cost. As we gradually move all customers based on your existing schema complexity, we will be emailing the admin users of your workspace. For additional details, keep an eye on the Community. You’ve read all about these great updates - What now? Sign in to your Amplitude account to start using these updates today. (Not yet an Amplitude user? Get started for free.) Subscribe to product updates from our Community to get the latest release highlights delivered to your inbox. Let us know which update you’re most excited about in the comments.

featured-image
featured-image

Acquisition Channels and Multi-Touch Attribution now in open beta

At Amplify we announced new features including Acquisition Channels and Multi-Touch Attribution. These new features are now in open beta and are available to customers in our Growth and Enterprise Plans. Acquisition Channels With Acquisition Channels, you can identify where your acquisition traffic is coming from, alongside your other performance measurements. You can also create rules that use existing properties and property values to automatically classify the channel used to source respective events in your product. Alongside our new Multi-Touch Attribution, you can now understand how your channels impact bottom-line product outcomes. i.e. which channels bring in power users, which features are true conversion drivers, how your channels retain over time. Learn more here. Multi-Touch Attribution With Multi-Touch Attribution available natively in Amplitude, you can easily distribute credit for your marketing programs using pre-built attribution models out of the box that can be configured on your metric. If the pre-built attribution models do not meet your needs, you can also create a custom model. Unlike other solutions, the power of the Amplitude Behavioral Graph enables unlimited look-back windows on attribution. By combining product + acquisition data, you can attribute product usage by acquisition source as well as see how product features or content impact product success events. Learn more here. By combining new acquisition insights along side Multi-Touch attribution, we want to help customers measure how effective your acquisition investments are in driving product engagement, as well as the impact of your channel strategy across the customer journey. We’re excited to see you take advantage of these new capabilities inside Amplitude!

featured-image
featured-image

September 2022 Product Release Highlights: Updates make it even easier to do great work in Amplitude

It’s never been easier to power data-driven products and experiences in Amplitude. The product team released updates last month to help customers be even more effective, including enhancements to existing features and new workflows. Updates are available to all Amplitude customers and in the EU Data Center unless otherwise specified. Summary Analytics Timezone customization for charts and dashboards Add Amplitude charts to Miro boards Audiences Distinct day and nested cohorts Data Derived properties enhancements Data warehouse import improvements Event streaming debugger view Experiment Open Experiment charts in Analytics Experiment end notifications Home page improvements Amplitude Analytics New integration and customization options Easily add Amplitude charts to Miro boards Now customers can easily search for and add Amplitude charts directly into Miro boards without switching between the two platforms. EU Data Center availability coming soon. Learn more about the Miro integration . Customize timezones for charts and dashboards By popular demand, customers can now change time zones at the individual chart or dashboard level without impacting their project. Amplitude Audiences New cohort enhancements Target users based on consistent behavior with distinct day cohorts Now available in the cohort builder, customers can create cohorts defined by the number of distinct days a user has done a behavior. For example, a customer could create a cohort of users who favorited an item on their site at least once per week in the last 30 days. Define new audiences based on existing cohorts With new nested cohorts, customers can define an audience by referencing and changing the filters of an existing cohort. They can use nested cohorts to create groups of users that are common to multiple existing cohorts or filter down to a subset of users within a cohort that share properties or behaviors. Amplitude Data More clarity and ways to use data Event Streaming Setup just got easier with the new debugger view The debugger view provides customers with live errors and logs for specific data payloads. Learn more about new event streaming capabilities . Create sophisticated data transformations with derived properties enhancements With derived properties, customers can create new event and user properties based on functions and operators they can apply across multiple existing properties, including: Event properties User properties Group properties Lookup properties Channel classifiers Customers can now also create derived properties from other derived and transformative properties. Available to Enterprise and Govern Add-On (formerly “Taxonomy Add-On”) customers. Learn more about derived properties and use cases . Understand your data imports easily Customers have access to a new metrics page within S3 import sources. Get greater clarity into how much data is imported over time, the number of data errors, the type of data errors, and more helpful information. Amplitude Experiment Improvements to the product experience Easily open Experiment charts in Analytics View Experiment charts in Analytics in just one click with the new “Open in Analytics" button. Now it’s easier for customers to add Experiment analyses to Notebooks, Dashboards, or anywhere else they monitor and communicate with their team. Available to paid customers. EU Data Center availability coming soon. Get alerted when a test is ready for a decision with Evaluation Notifications With new Evaluation Notifications, customers get an email when their test reaches statistical significance. They don’t need to constantly check progress or have a completed test sit idle. Coming soon: Experiment will send email notifications for end dates and issues like sample ratio mismatch. Available to paid customers. EU Data Center availability coming soon. Enjoy improvements to the Experiment home page Customers can see new details about recent tests, such as start/end dates and decisions, on the Experiment home page. They also have the option to customize what’s displayed. Available to paid customers. EU Data Center availability coming soon. Never miss an update Get release highlights and launch news delivered to your inbox. Subscribe to product updates from our Community . If you’re not an Amplitude customer yet, let’s change that! Get started for free .

featured-image

August 2022 Product Release Highlights: New features make Amplitude even better

The Amplitude product team had a busy month releasing 18 (!!!) updates across our platform. These releases support teams in making better decisions with data, delivering better experiences for their customers, and better understanding how their experiments are running. Let’s take a look at the highlights. Amplitude Analytics: Features that help teams get more from their data Make better decisions with Data Tables Customers can analyze their most important metrics in a single view with Data Tables. This lets them unlock multi-metric, multi-dimensional analysis to improve analysis of marketing attribution, market segmentation, experiments, and more. Learn more about Data Tables . Get answers to important questions fast with Starter Templates Customers can answer essential product questions quickly with out-of-the-box dashboards they can customize and save. Not sure where you’d begin with Starte r Templates? Try determining your product’s North Star with a new set of Product KPIs we’ve released in the feature. Demo the experience for free . Learn more about Starter Templates . Customize event frequency charts with new data bucketing options By popular demand, Analytics customers can now tailor the view of their event segmentation frequency charts with custom buckets. They can choose to adjust the minimum, maximum, and interval size or use the custom bucket modal to enter their own bucket ranges. Enjoy improvements to our user stream experience Customers who use the user streams feature will see an improved version of the experience, accessible from most charts via Microscope. These improvements include the ability to: Create cohorts Export users to CSV Filter events Link to the user page with a clear CTA for a deeper dive into user and event information See up to 20 users at once without having to click “Show more users” Amplitude Customer Data Platform: Better real-time campaigns and data visibility Recommend is now Audiences We’re introducing Audiences as an expanded version of the product formerly known as Recommend. As the new name suggests, Audiences provides powerful audience discovery, segmentation, and activation to help customers better target their users with personalized content and experiences. Learn more about Audiences . Build dynamic campaigns with real-time syncs Update and sync cohorts every minute to create in-the-moment engagement campaigns. Real-time syncs are now available to all Audiences customers on paid plans. Learn more about real-time syncs , and how to set them up in Audiences . Data Management: Connect your Data Warehouse to Amplitude Data Warehouses (DWH) Destination Connections are now available at no additional cost for all customers on Starter and Scholarship plans! Customers can access all destination connections to leading cloud data warehouses and storage providers including: Amazon S3 Snowflake Redshift Google Cloud Storage BigQuery Learn more about setting up your Data Warehouse . Event streaming destinations now available to all customers Event streaming destinations enable Amplitude customers to power real-time, targeted experiences. With event streaming, you can use the rich behavioral data that is captured, resolved, and transformed in Amplitude to enrich customer profiles and send data to marketing, sales, and infrastructure tools. This functionality is now generally available to all customers. You can stream up to 10M events per month for free! Learn more about available and upcoming event streaming destinations and upcoming destinations on our roadmap . Simplify onboarding and managing data set configurations with Guided Configuration Onboarding data sets to Amplitude and managing existing import configurations has never been easier. Configure a Cloud Storage import with the new Guided Configuration option. Once customers have connected their Cloud Storage (AWS S3, or GCP Storage) bucket in the Sources section of Amplitude, they can map and/or transform data to the Amplitude model specification. Learn more about Guided Configuration . Support data security with new event data retention options Customers can now control how long their data is retained on the Amplitude platform by setting an event retention policy for organization-level data stored in Amplitude. If you’re a current customer, reach out to your account team to set up this functionality. Filter tracking plan data right within Amplitude With new data filtering for tracking plans, customers can drill down into table data more granularly right within their account. There’s no need to download a CSV file to manipulate the data. Stay up-to-date on tracking plan comments with Slack integration in Data Customers can choose to get notified when someone comments on their tracking plan. They can also connect projects to Slack workspaces to get notifications about plan updates. Learn more about Slack integration in Data . Understand where bad data is coming from to quickly fix issues It used to be that customers would see “unknown” sources in their tracking plan, making it challenging to find the source of bad data. Improvements to source data display all sources as shown on the connections page, now makes it easier to spot and fix errors in tracking plans. Amplitude Experiment: Experience updates help teams run quality experiments Save overhead with new local evaluation mode flags and experiments With new local evaluation in Experiement, customers get a boost in performance over running evaluation on a remote server. They also save the overhead of making added network requests. Learn more about local evaluation . Avoid accidentally making disruptive experiment changes with guardrail warnings Once an experiment has started running, it’s best practice to avoid changing how it’s set up to avoid unexpected results that are hard to interpret. With new guardrail warnings, a customer who is about to make such a change to the configuration of an experiment will see a pop-up message letting them know it could impact the validity of their results. Learn more about new notifications guardrail warnings . Understand when sample ratio mismatches happen to quickly fix them Sample ratio mismatches (SRMs) happen when an uneven distribution of users see your control and variant in an experiment. SRMs indicate that the experiment hasn’t been truly random so the results may not be conclusive. We added new charts to help customers understand whether there’s an SRM in an experiment, warnings to show it's been detected, and suggestions for next steps. Learn more about new warnings for SRM detection . Understand at-a-glance how much longer experiments need to run We added a "Duration Estimate" to the experiment while it's running that shows how much longer it needs to run to achieve statistical significance. Learn more about duration estimation . Enjoy a better experiment completion experience We've renamed the "Make Decision" button to "Complete Experiment" and improved some quality of life around decision making, such as the ability to roll back a decision made in error. Learn more about improvements to the experiment completion experience . There are more product updates on the way Don’t miss any of the latest product goodness! Subscribe to Product Updates to hear about them first. Not yet an Amplitude customer? Get started for free .

featured-image

Announcing Amplitude's new Event Streaming Destinations!

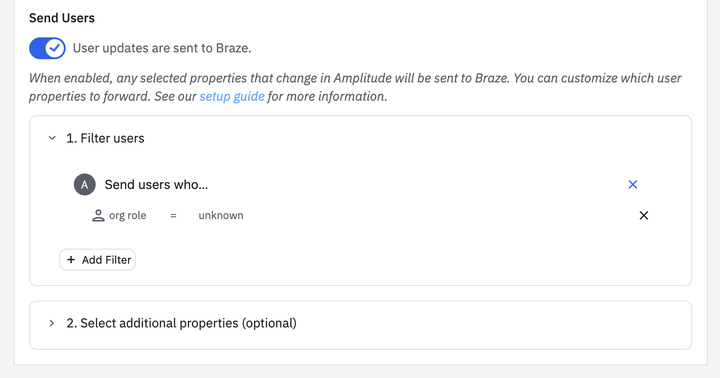
We are excited to announce the general availability of new event streaming destinations! Event streaming allows you to send the data in Amplitude across your stack. With event streaming, you can use the rich behavioral data in Amplitude to enrich customer profiles and send data to marketing, sales, and infrastructure tools in near real-time to power customer experiences. Destinations such as Braze, Google Analytics 4, Kinesis Data Firehose, Iterable, Customer i.o, Intercom, and Google Pub/Sub are now available, with many more destinations coming soon! This new feature includes powerful, no-code, configuration-based tools that give fine-grained control over the data you send. Decide exactly what users, events, and properties you wish to forward with the ability to filter by user, group, and event properties. In addition, see at a glance important metrics like event volume, end-to-end latency, and detailed Delivery Issue information to understand the performance and health of your integration. Here’s how some of our customers are using this new feature: Marco Polo was able to quickly power a ‘Welcome’ email campaign by streaming their sign-up events in real-time from Amplitude to Braze. RefaceAI was able to leverage Amplitude’s Kinesis Data Stream integration to pipe events in real-time from their mobile clients to their back-end services. This avoided building and maintaining an expensive custom pipeline. Invoice Simple was able to power a robust engagement campaign by sending a series of events to customize and tailor their messaging engagement campaign. Start using Amplitude as your insights-driven customer data platform today. You can stream up to 10M events per month for free! You can also keep track of this free event volume on your settings page.

Related products:Data Management
featured-image

Experiment: Duration estimation and conclusion clarity

We have two minor updates to quickly talk about to the lifecycle component of Experiment. Lifecycle is the structure of Experiment in stages with Plan, Configure, Monitor, and Analyze as seen across the top of the page. We’re so grateful for all of our customers who provide us feedback on the overall lifecycle of their experiments. We’re always aiming to have this lifecycle match what happens in reality. Two areas we’ve received feedback on are from users wanting to have a better understanding of how long it will take for an experiment to finish running as well as a bit more clarity on what to do when an experiment ends. Analyze: New Duration Estimation We have now added a Duration Estimate to the summary card while your experiment is running. This callout provides an estimate of how much longer we believe it will take for the analysis to reach statistical significance as it relates to your primary metric. We calculate this largely based on how much traffic the experiment has been receiving so far and project that forward as an estimate. We also provide an estimated best case and worst case scenario. Analyze: Completing an Experiment Previously when an experiment reached statistical significance, we presented users with a button labeled “Make a Decision”. While we ultimately think this is the best outcome for an experiment, to make a well informed product decision based on the data, sometimes an experiment does not end in making a product decision. Sometimes users would not click this button because they weren’t ready to make a final decision. We’re now changing that button to read “Complete Experiment”, making that button more prominent in a few places, as well as making it more dynamic based on what our recommendation is. We’re also adding the ability to go back and revisit a decision, allowing users to change their previous decision. We hope this brings a bit more clarity to the purpose of this button to complete an experiment and take a next step. Thank you again to everyone that continues to drive incredible decisions through Experiment and we’re always looking for ways to improve the product, both big and small.

Related products:Experiment
featured-image

Experiment: New Warnings for SRM Detection & Guardrails

Update by Stephen Choi, Marina Sergeyeva, & Shelley Wang, our lead engineers on diagnostics and warnings One area that has become increasingly important for our customers is the ability to be warned when experiments are not quite going as expected. This meta-analysis of the quality of experiment data ensures that our customers can trust the analysis and results of each experiment. Last month we released diagnostic run-time charts, as the first step in this direction, giving users the ability to track the health of their experiments in real-time. Watching the assignment and exposure event data allows anomalous data to surface that is otherwise hidden in other tools. We’re excited to continue to expand on that work this month with two new updates: SRM Detection warnings and Experiment guardrail warnings. SRM Detection Warnings 2 new charts & 2 new warning boxes Sample Ratio Mismatch (SRM) occurs when there is an uneven or unintended distribution of exposures to the control and variant(s) in an experiment. As an example, if you’ve set a 50/50 allocation in your experiment so that 50% of your users see the control and 50% of your users see the variant, you would expect to see a 50/50 split in the actual exposures as planned. However, due to various reasons outside of our control, sometimes more users can see the control or the variant. This is usually an unintended bug in your code or deployment of the experiment in the feature flags. When an SRM occurs, you may see something like 55% of users seeing control and 45% of users seeing the variant. This indicates something has gone wrong with the true randomization of the experiment and that the analysis & results should be highly scrutinized. We will be publishing a blog on SRMs in the near future with more in-depth explanations on why they’re important to catch. Subscribe to our blog so you don’t miss that! What we shipped! We are adding two new charts to help users to get information to indicate whether there is a sample ratio mismatch ratio in the running experiment as well as warning boxes when an SRM has been detected. Assignment to Exposure conversion chart This chart provides information on how many assignment events actually have converted to an exposure event. It is another form of displaying the assignment and exposure events shown in the Monitor tab already. If there is a significant difference in the conversion for each variant, then it is a good indication of why an SRM, if at all, is happening. Variant Jumping chart for each variant Variant jumping is when the same user sees two or more variants. This is another good indication of an SRM if the numbers are significantly high. SRM Detection Warnings There will now be a warning banner in the Monitor tab and on the summary card in the Analyze tab if a significant SRM has been detected. We also provide a help center article which provides recommended actions. Experiment Guardrail Warnings Making foundational changes to the setup of an experiment after it has already started running is not best practice and can lead to unexpected results that are difficult to interpret. Customers have asked us to provide ample warning if they are about to make a change to the configuration of an experiment that could lead to invalidating the analysis. These new guardrail warnings will generate a pop-up message when a user is about to make a change that could affect the validity of an experiment. When experiments influence product decisions the data must be trusted. If there are other areas in the product where you worry about data quality and experiment integrity, please let us know!

Related products:Experiment
featured-image
featured-image
featured-image

Experiment Local Evaluation (General Availability)

Update by Brian Giori, lead engineer on our feature delivery system We’re excited to announce that local evaluation has been promoted to general availability! All Amplitude Experiment customers may now create local evaluation mode flags and experiments, or migrate existing flags to local. What is local evaluation? Server-side local evaluation runs evaluation logic on your server, saving you the overhead incurred by making a network request per user evaluation. The sub-millisecond evaluation is perfect for latency-minded systems which need to be performant at scale. Performance The primary benefit of local evaluation is its performance compared to remote evaluation. A single flag evaluation completes in well under a millisecond by avoiding having to make a network request per user evaluation. One local evaluation beta customer partner, especially affected by network latency caused by geographical distance, shaved over 100ms from their end-user latency, and nearly doubled server throughput during peak hours. Tradeoffs Because local evaluation happens outside of Amplitude, advanced targeting and identity resolution powered by Amplitude Analytics is not supported. That said, local evaluation allows you to perform consistent bucketing with target segments, which is sufficient in many cases. Feature Remote Evaluation Local Evaluation Consistent Bucketing ✅ ✅ Individual inclusions ✅ ✅ Targeting segments ✅ ✅ Amplitude ID resolution ✅ ❌ User enrichment ✅ ❌ Sticky bucketing ✅ ❌ SDKs Local evaluation is only supported by server-side SDKs which have local evaluation implemented. Local evaluation for Ruby is in active development. Let us know if there’s a specific language you’d like support for! SDK Remote Evaluation Local Evaluation Node.js ✅ ✅ JVM (Beta) ✅ ✅ Go (Beta) ✅ ✅ Ruby (Beta) ✅ 🚧 Python (Beta) ✅ ❌ 🚧 Ruby SDK is in active development for Local Evaluation Advanced use cases Edge-local evaluation evaluation-js library can be used to run evaluation on edge compute platforms. Works on AWS Lambda@Edge, Cloudflare Workers, and Akamai EdgeWorkers Provides up-to-date variants for a user even if the content is served from the cache. Server-side rendering Node.js SDK is used to run evaluations when the page is rendered on the server. Works with popular SSR frameworks (e.g. Next.js).

Related products:Experiment
featured-image

Experiment Diagnostic Run-Time Charts

Trusting the data that powers your experiments When you’re trying to make critical decisions about the changes to your product, the ability to trust the results of your experiments is vital. The outcome of each experiment you run is only as good as the quality of the data being collected. Most other experimentation platforms only provide you with a final calculation or analysis, without ever exposing the underlying data. This is problematic! Sample Ratio Mismatch (SRM) is a really common problem in a lot of experiments that often goes undetected and unnoticed. An SRM occurs when the number of users in your control and variant are either uneven or don’t match your planned distribution split. While an experiment can reach statistical significance and a platform can report it, an SRM in the experiment can invalidate those results. If you don’t have access to the underlying data in the analysis, you’ll never you’re looking at faulty results. “At LinkedIn, about 10% of our triggered experiments used to suffer from bias” (Automatic Detection and Diagnosis of Biased Online Experiments ) In fact, it happens in about 6-10% of all A/B tests run. And, in redirect tests, where a portion of traffic is allocated to a new page, SRM can be even more prevalent. (Sample Ratio Mismatch (SRM) Explained ) "I can recall hundreds of SRMs. We consider it one of the most severe data quality issues we can detect.” ( https://exp-platform.com/Documents/2019_KDDFabijanGupchupFuptaOmhoverVermeerDmitriev.pdf ) “I am working on resolving an SRM just now. The SRM is critical. The analysis is completely untrustworthy.” ( https://exp-platform.com/Documents/2019_KDDFabijanGupchupFuptaOmhoverVermeerDmitriev.pdf ) One of the biggest advantages of using Amplitude Experiment is the close tie-in with Analytics, allowing you to track your experiments in real-time, across entire user segments or down to an individual user’s journey. In short, Amplitude makes available all of the underlying data that’s powering the outcomes of your experiments. Trusting the data that powers your experiments is vital, and over the next several months we’re focusing on making that a bigger component of Experiment. Now When you log in to Amplitude Experiment, and view the Run tab, you’ll notice some changes, providing more insights into both the Assignment and Exposure events of each experiment you run, in real-time. You’ll now also be able to switch between cumulative and non-cumulative views of your data. New Assignment and Exposure Events Charts Track both exposure and assignment events in real-time, actively monitoring how many users are assigned and exposed to your control or variant(s). Toggle between both cumulative and non-cumulative views. With these new views, you’ll be able to quickly detect anomalies in your experiment delivery. For example, if you’re seeing too many users getting exposed to a variant over a control, this may indicate a Sample Ratio Mismatch and potentially invalidate the results of your experiment. Next Over the coming months you’ll see us make additional improvements to this page, to provide more detail about how your experiments are running and more insights into the data powering the analysis. Follow this page to get notified as we start working on: Assignment-to-exposure conversion chart Variant jumping Diagnostic alerts and warnings for things like Sample Ratio Mismatch

Related products:Experiment
featured-image