
New features offer deeper analyses, simplified workflows, next-gen AI tools
Amplitude helps you see what your customers experience, understand what drives growth, and build better digital products --- all in one easy-to-use Digital Analytics Platform.
This month, we’re excited to announce a slew of new updates that offer even deeper insights, simpler workflows, and the latest-and greatest tools in AI analytics. Highlights include AI feedback and Visibility, new experiment views, Cohort improvements, and more!
⭐️ Updates are available on all plans and to all Amplitude customers – including the EU Data Center– unless stated otherwise.
Summary
New Analytics releases
- Introducing AI Visibility
- New Cohort Builder Landing Page
- Major improvements to Cohort Dropdown
- Duplicate Charts from Dashboards
New Data & Activation releases
- Drive innovation with AI Feedback
- Introducing: SDK remote configuration server url for proxy
- Updated TikTok, LinkedIn and X Ad sources
- Enjoy Currency Conversion in event streaming
- Get detailed analyses with Autocapture: Page Properties
- User Forward Filtering now available for Event Streaming
- Unlock testing ROI with Warehouse Metrics in Experiment [Beta]
New Guides and Surveys releases
- Introducing: Conditional Logic V2
- Custom Fonts and Text Alignment now available for Mobile [Beta]
- New popover positions for Guides and Surveys
New Feature and Web Experimentation releases
- See high-level data with Experiment timeline view
New Analytics releases
Get clearer insights into what drives customer behavior. Amplitude Analytics gives you self-serve access to critical insights across the full customer journey.
Introducing: AI visibility
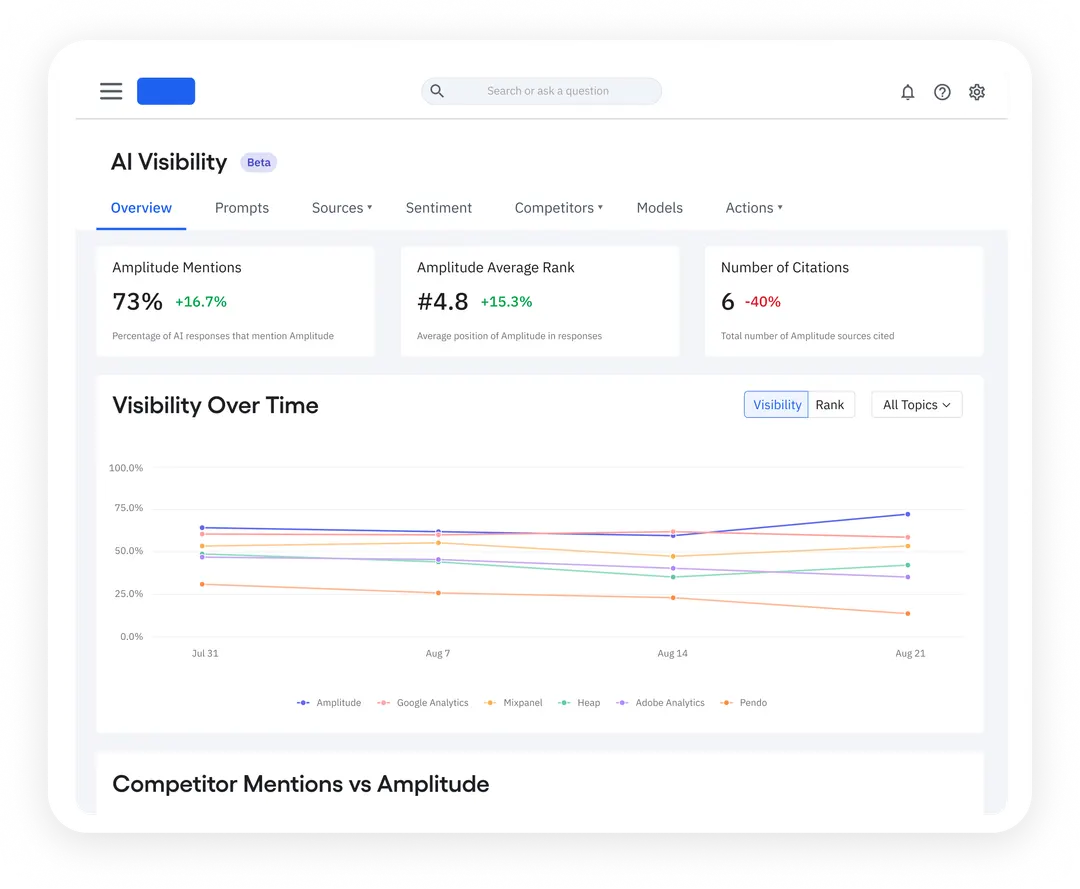
The new era of search is here! With AI visibility, Amplitude helps you analyze how often your brand is mentioned in AI Search and what Language Learning Models (LLMs) think about your business and products.
As search traffic drops and AI chat traffic continues to grow, this feature will keep your team abreast of branded search data across AI platforms and on the cutting edge of search data.
The best part? We’ll soon be offering guidance and recommendations to help your team capture more AI mentions and outrank competitors.
Learn more about AI Visibility.
⭐ ️Availability: This feature is available to all customers on all plans. (And for non-customers, you can get a free report on how your brand appears across AI answers.)
🔓 Access this feature via Marketing Analytics in Amplitude.
New Cohort Builder Landing Page
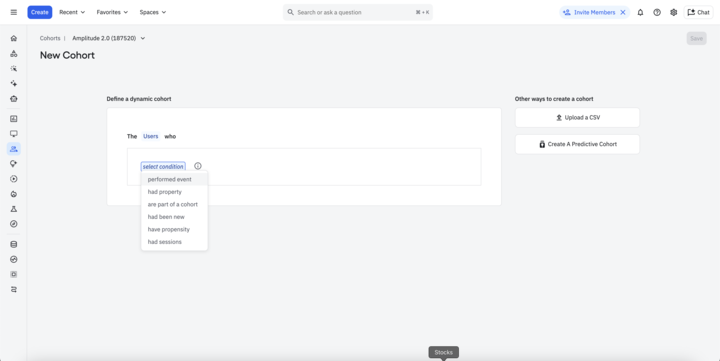
Ready to create Cohorts faster and with fewer clicks? This month, we rolled out a simplified and targeted Cohort builder landing page to reduce the number of steps to cohort page creation. This eliminates interstitial screens and allows your team to create a custom cohort definition, CSV Upload Cohort, or OOTB Predictive Cohort right from the very first screen. Happy building!
🔓 Access this feature via the cohort creation page or learn more about the new experience.
Major improvements to Cohort Dropdown
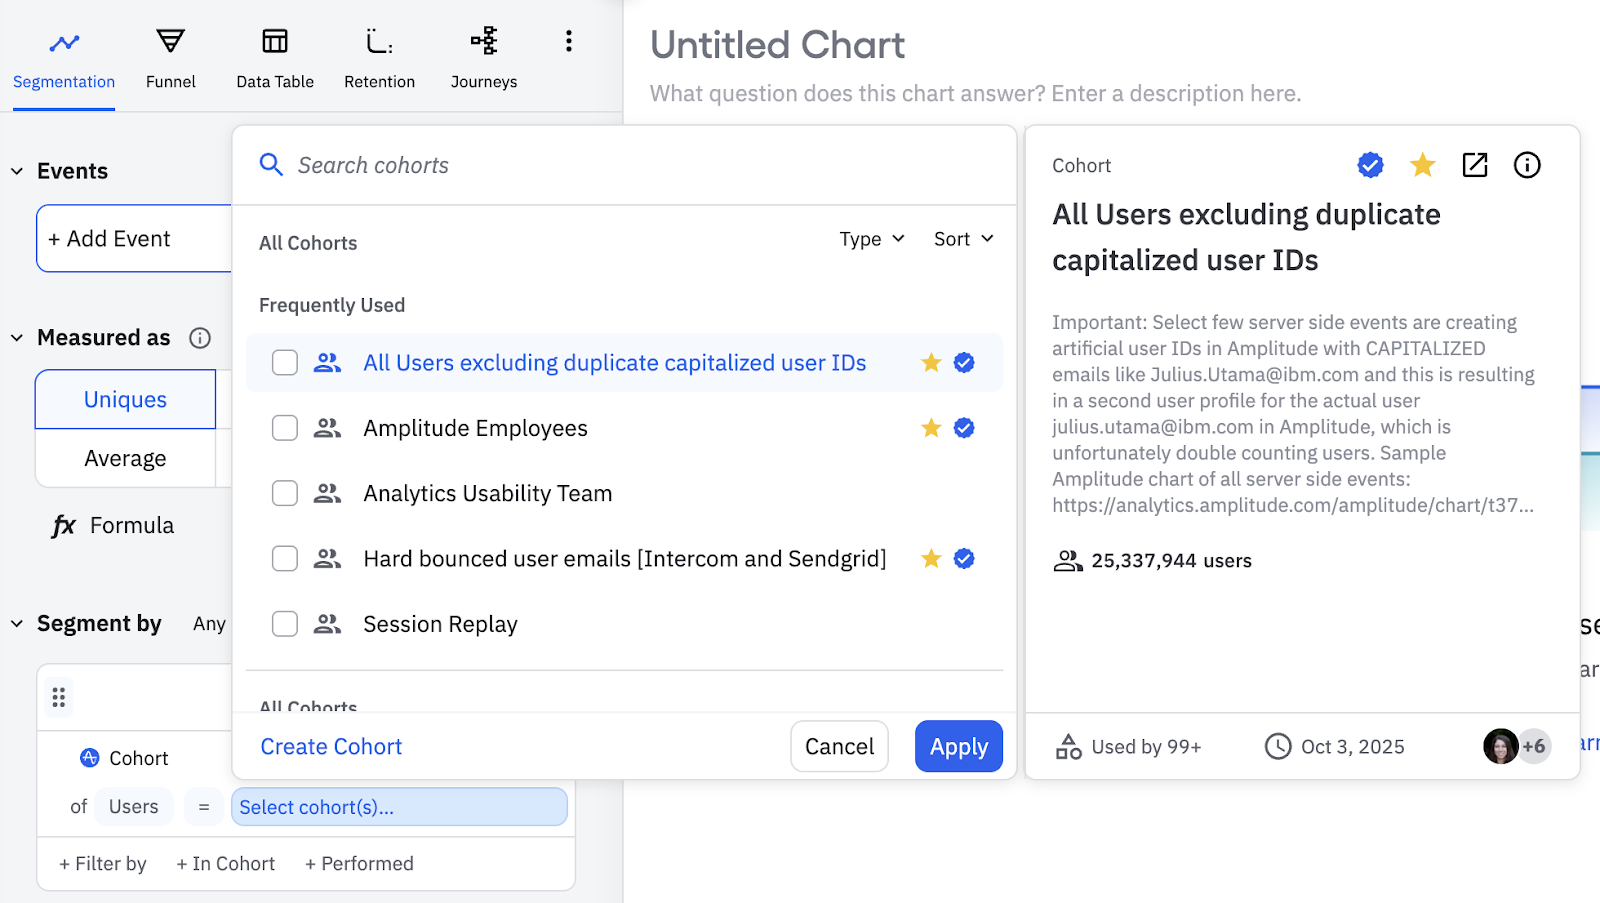
This month we improved the search and select experience for cohorts, charts, dashboards, experiments, guides, surveys, and more! This update introduces frequently used cohorts, favorite cohorts, and the ability to view more information in the details panel. The best part? Your Search results will prioritize official, favorited, and your most recently created cohorts.
⭐ ️Availability: This feature is available to all customers on all plans.
🔓 Access this feature anywhere cohorts are used across the product.
Duplicate Charts from Dashboards
A tiny-but might change for our chart power users. You no longer have to open a chart to duplicate it – you can now duplicate directly in Dashboards.
⭐ ️Availability: This feature is available to all users on all plans.
New Data & Activation releases
Get trusted data to power insight about your product. Amplitude helps you proactively manage and govern your data.
Drive innovation with AI Feedback
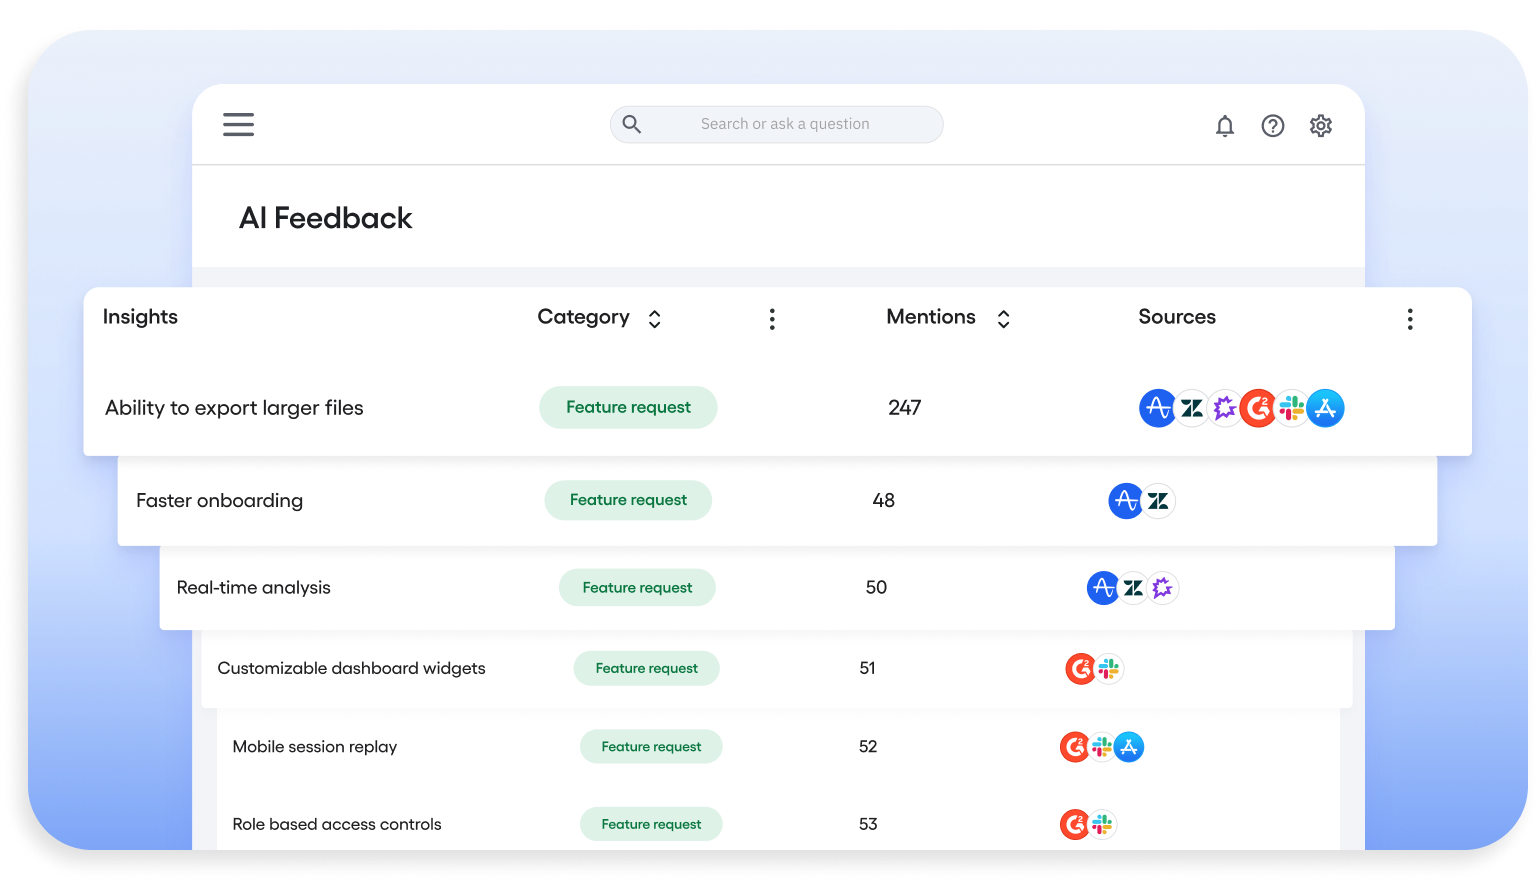
Amplitude’s AI Feedback is the new way to listen to users at scale. Our latest feature harnesses the power of AI to analyze reviews, surveys, and user feedback, so you can turn unstructured language into clear insights about customer needs and product opportunities. Simply put, AI feedback helps you understand what customers are saying, why it matters, and what you can do about it.
And because AI Feedback is fully integrated into Amplitude, feedback never sits in a silo. It flows into cohorts, surveys, and session replay, creating a complete loop from insight to action. Teams can now connect customer feedback to behavior, prioritize features, and turn insights into what customers actually want. With AI feedback, your team can expect faster innovation, stronger feature adoption, and higher retention across the product lifecycle.
⭐ ️Availability: This feature is available to all customers on all plans.
🔓 Access this feature via the left navigation under Users → AI Feedback.
Learn more about AI Feedback.
Introducing: SDK remote configuration server url for proxy
Ready to configure SDK remotely without code changes or deployment? Our latest release allows users to specify a custom server URL for remote configuration requests. This enables you to proxy requests through your own servers to bypass ad blockers or implement custom routing.
🔓 Access this feature via amplitude/analytics-browser 2.28.0 and above.
Learn more about proxy remote configuration requests.
Updated TikTok, LinkedIn and X Ad sources
You asked and we listened! We’ve made several usability improvements to Social Ad sources, including:
- Displaying the event count in the Sources page.
- Disabling changing of the selected ads account.
- OAuth flow redirects back to setup page when OAuth fails
- Error classifications
⭐ ️Availability: This feature is available to all customers on all plans.
Enjoy Currency Conversion in event streaming
Good news! The event streaming pipeline is now able to forward currency converted revenue and currency converted price to final destination.The target currency for property calculation will default to USD, or can be changed in the org settings page.
With this release, users can analyze multi-currency revenue data while sending transaction with local currency only, and then maintain revenue and price data in downstream destinations.
⭐ ️Availability: This feature is available to all customers on all plans.
Learn more about currency conversion.
Get detailed analyses with Autocapture: Page Properties
This month we updated Autocapture to include new page properties consistently across both all Autocapture events and precisely-tracked events, adding more ways to filter analyses just by using the latest Browser SDK.
The plug-in is automatically enabled for everyone on the latest SDK, and adds the following properties to all events (except from certain special events like $identify, $groupidentify, and revenue_amount):
[Amplitude] Page Domain
[Amplitude] Page Location
[Amplitude] Page Path
[Amplitude] Page Title
[Amplitude] Page URL
[Amplitude] Previous Page Location
[Amplitude] Previous Page Type
These new properties allow you to perform more detailed analyses without extra instrumentation.
⭐ ️Availability: This feature is available to all customers with browser SDK above 2.29.0🔓 Access this feature via Amplitide/analytics-browser 2.29.0 and above.
Learn more about the Page URL Enrichment Plugin.
User Forward Filtering now available for Event Streaming
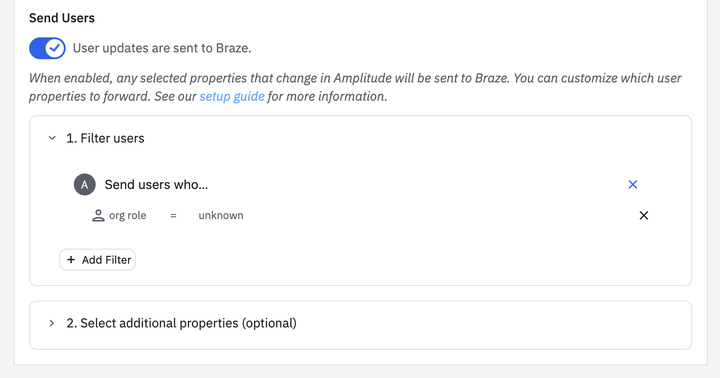
Amplitude now allows filtering on user forwarding so you can control which users get sent to the destination. No more pesky anonymous users racking up a huge error log or unnecessary usage of your monthly event streaming quota. Just more control over user creation without extra costs or junk data!
🔓 Access this feature within event streaming destination configurations for destinations that support user forwarding.
Unlock testing ROI with Warehouse Metrics in Experiment [Beta]
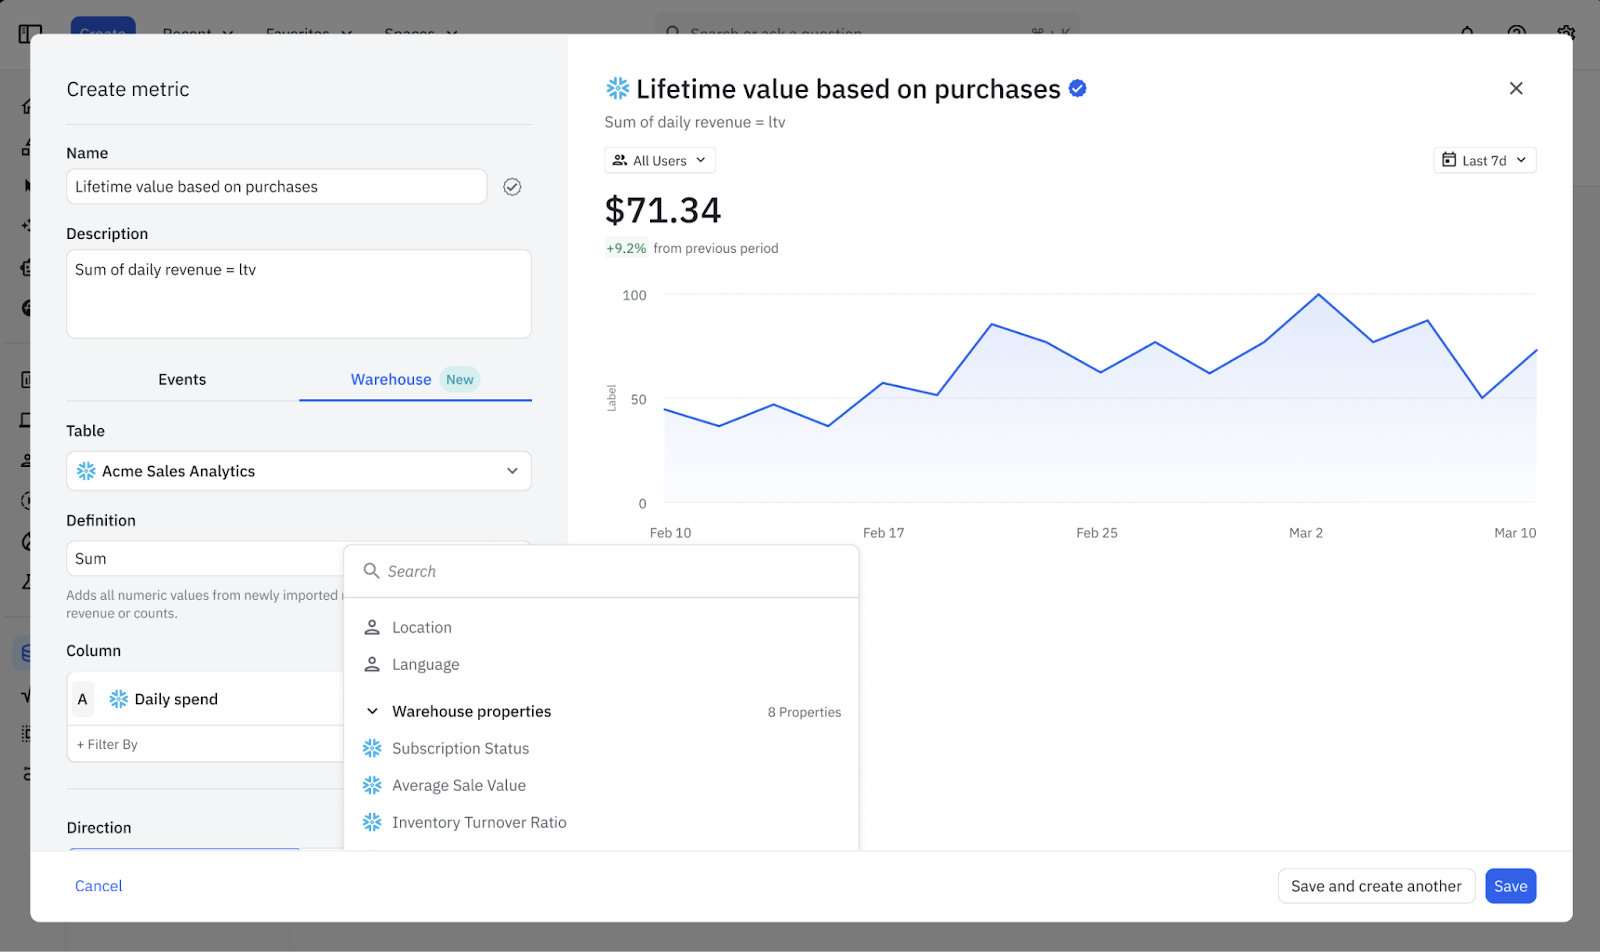
Amplitude knows that your team doesn’t measure the business in events – you measure it with metrics. That’s why we’re thrilled to introduce Warehouse Metrics for Experiment.
This feature allows you to import pre-computed business metrics directly from your Snowflake data warehouse into Amplitude to run experiments. This bridges the critical gap between behavioral analytics and business outcomes and helps prove the ROI of your experiments. By allowing teams to use their trusted warehouse-defined metrics as experiment goals, we hope you can finally measure the true business value of every test.
⭐ ️Availability: This feature is currently in closed beta. Contact your Customer Success Manager or Account Executive if you’re interested in enrolling.
Learn more about Warehouse Metrics.
New Guides and Surveys releases
Close the loop with Amplitude’s Guides and Surveys. Act on trends and hypotheses with personalized customer experiences.
Introducing: Conditional Logic V2
Good news! Users can now personalize their Guides and Surveys with conditional actions or branching paths based on user properties. Updates include:
- Personalization for higher engagement: tailor your Guide or Survey flow to different user segments based on who the user is (e.g., region, plan tier, role), not just how they respond.
- Less duplication: Instead of building multiple guides or surveys for each combination, customers have more power to build a single "unified" guide with branching paths.
- Support for more complex logic: Compound conditions let you fine tune your targeting. For example,
plan == free and country == New Zealand.
🔓 Access this feature via Inside the Action Selector for a button, choose Evaluate conditional logic (note - the old "conditional logic toggle" has been removed)
Learn more about conditional logic in Guides and Surveys.
Custom Fonts and Text Alignment now available for Mobile Guides & Surveys [Beta]
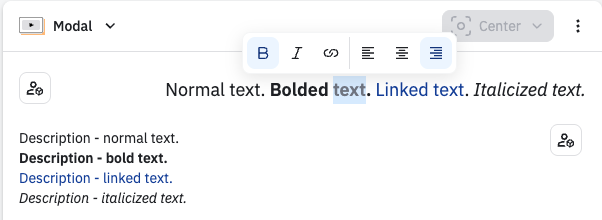
- Select a Google Font or upload custom fonts for in-app nudges
- Configure the title and content alignment (e.g., left, center, right) separately for nudges
This release provides a more consistent and polished in-app experience for your users, along with enhanced localization and accessibility options for various languages and markets.
⭐ ️Availability: This feature is available with Android, iOS, and React Native SDKs v1.5.0.
🔓 Access Custom Fonts in our Guides & Surveys Theme, or customize themes individually. For text alignment, update the individual guide or survey configuration.
Learn more about Guide and Survey themes in Amplitude. | See all Google fonts.
New popover positions for Guides & Surveys
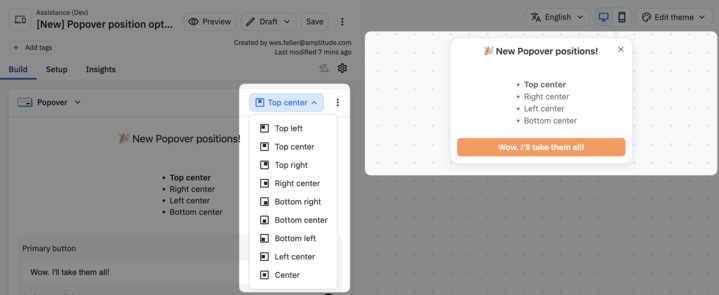
This month, we introduced new popover positions for Guide & Surveys. No more blocking important UI with popups, just flexible positioning for your most important messages.
New Feature & Web Experiment releases
Drive faster action from crystal clear test results. Amplitude helps you test, analyze, and optimize your product and web experiences at scale.
Experiment timeline view
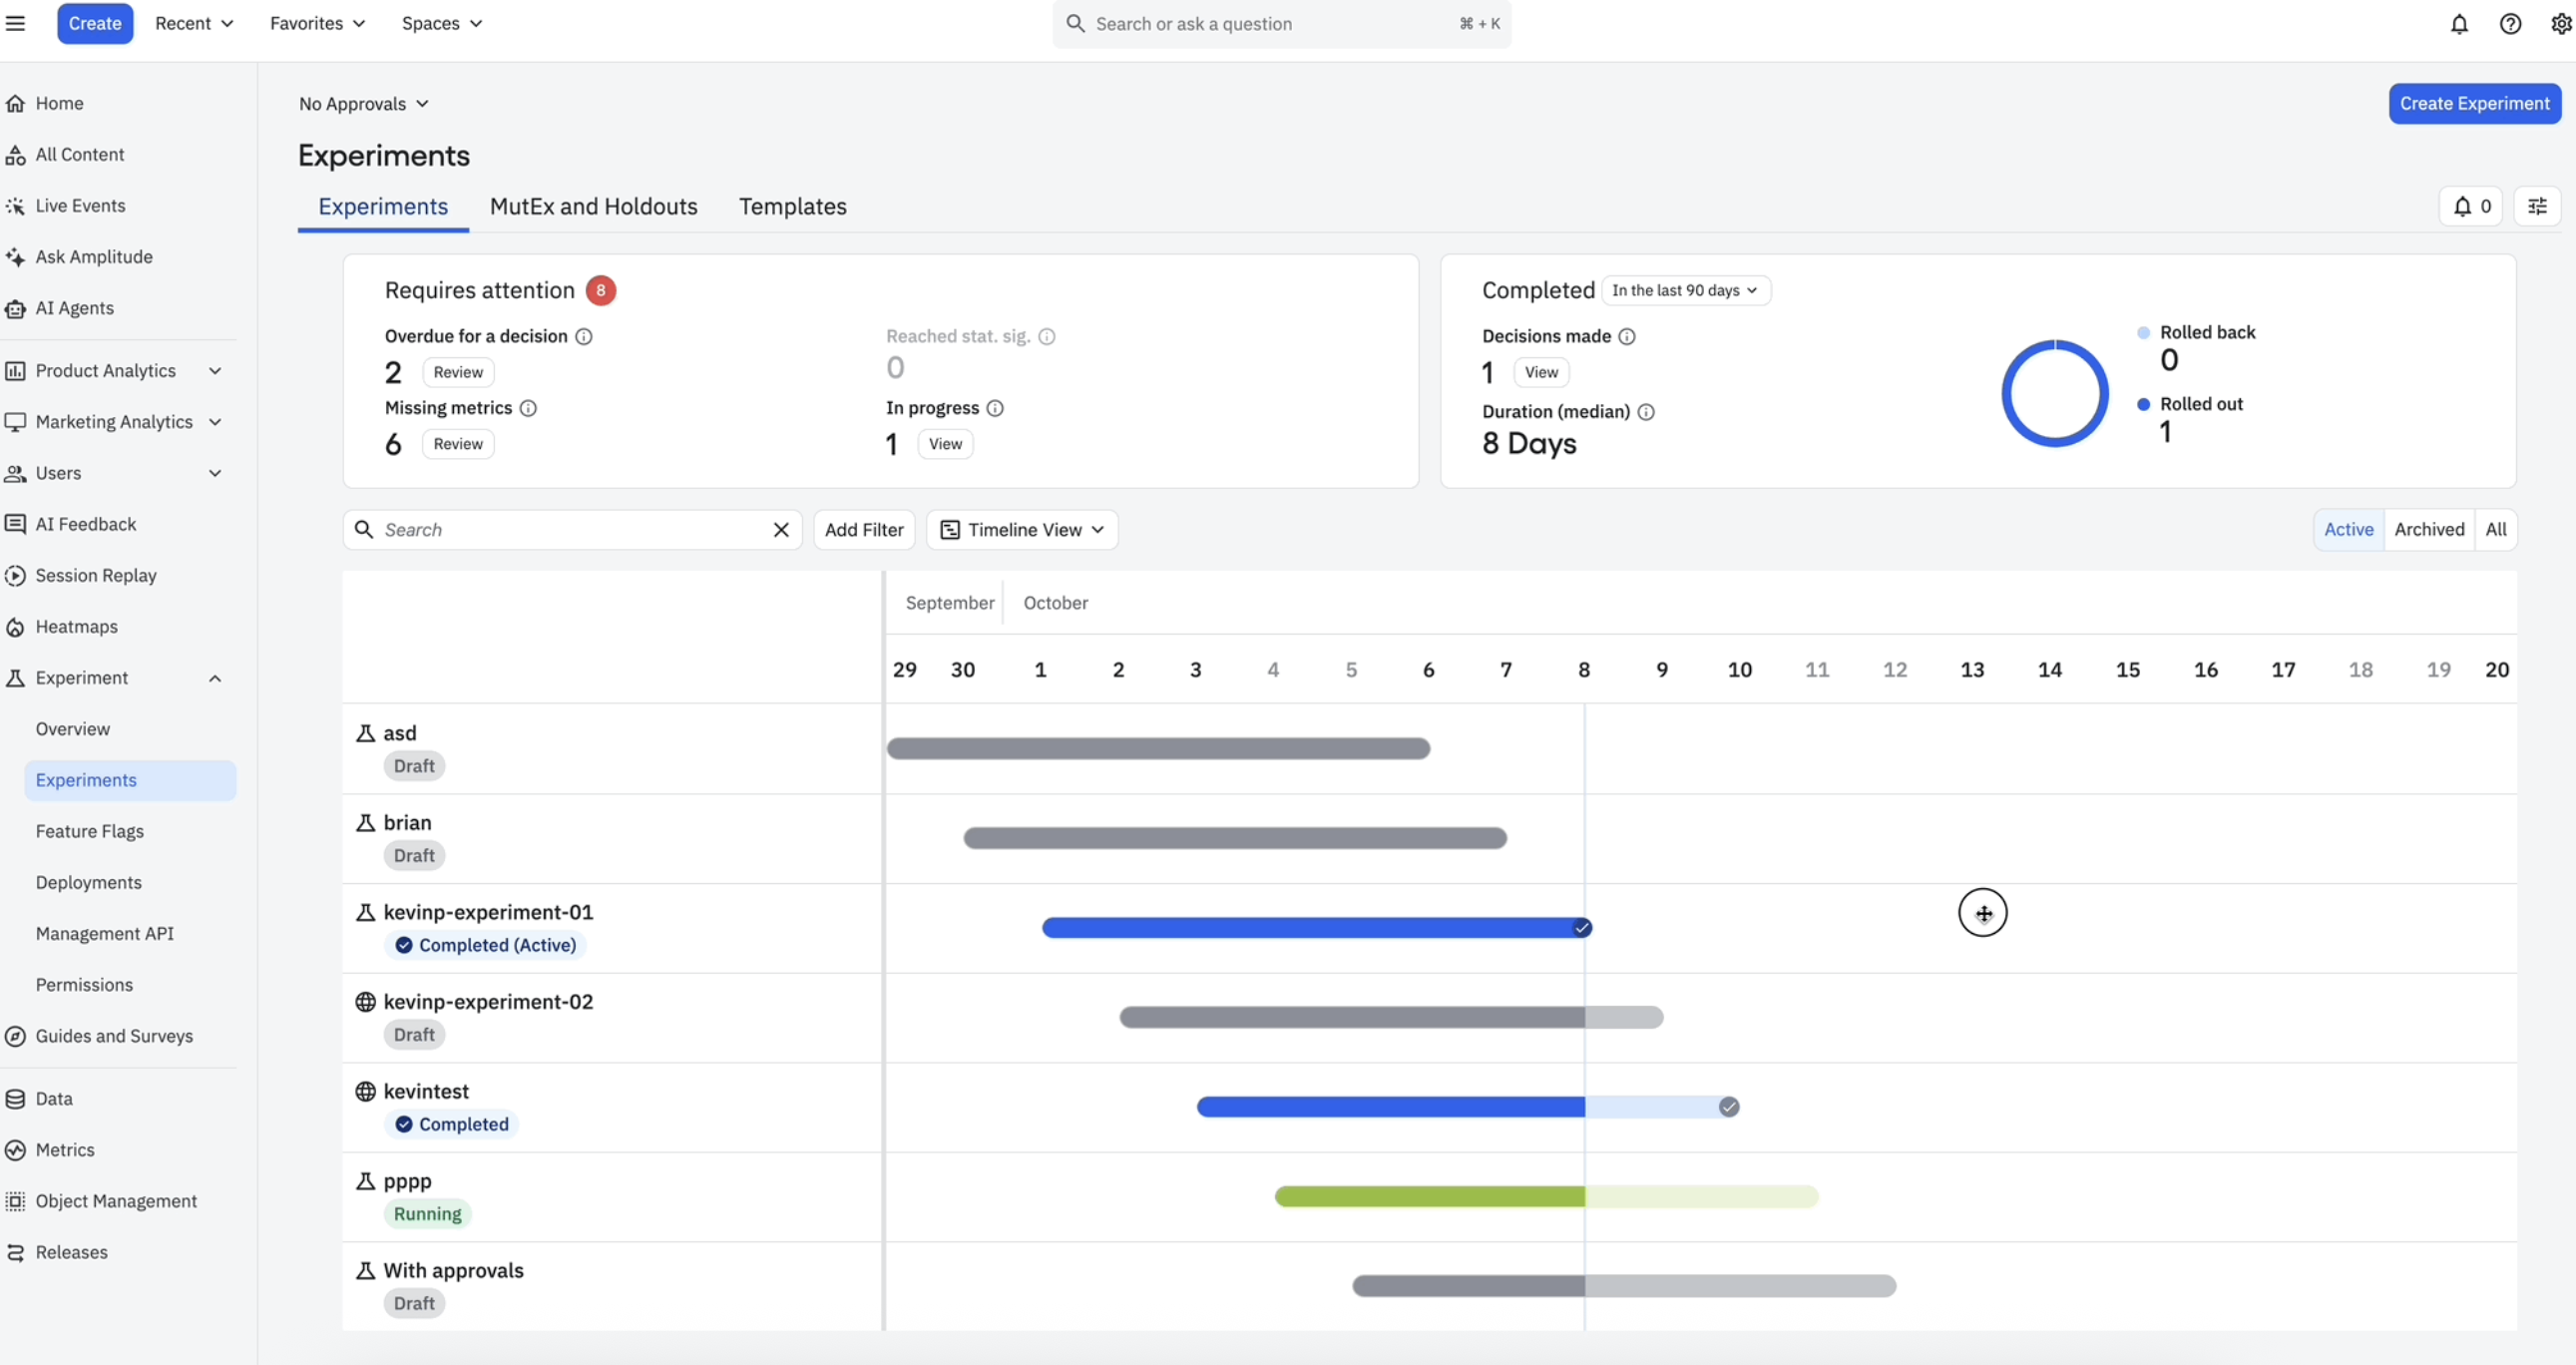
Well, those days are over! Our latest release offers a high-level program view of the experiments designed for product leaders driving experimentation strategy. The view is built using a Gantt chart to help visualize the experiments in a timeline view, color-coded by status and completion indicators.
You’re all caught up! Here’s what’s next…