Winter Platform Release Highlights
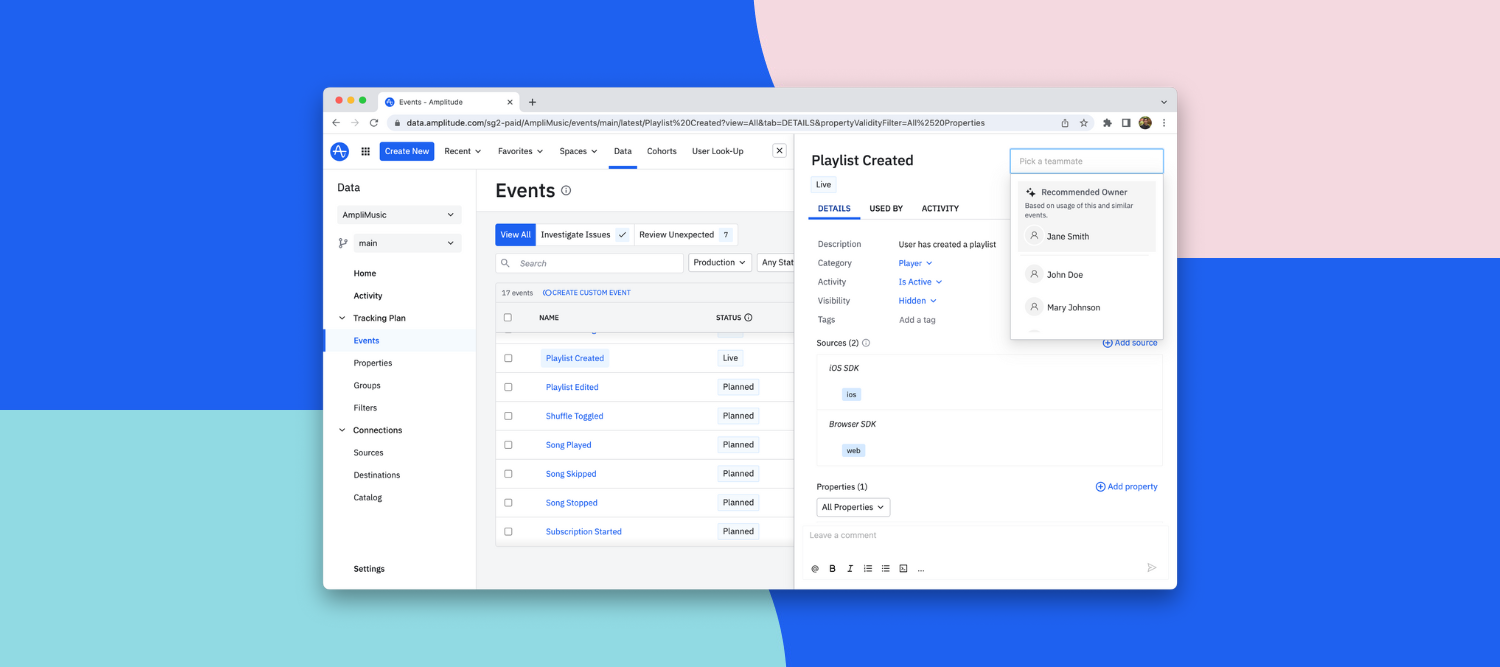
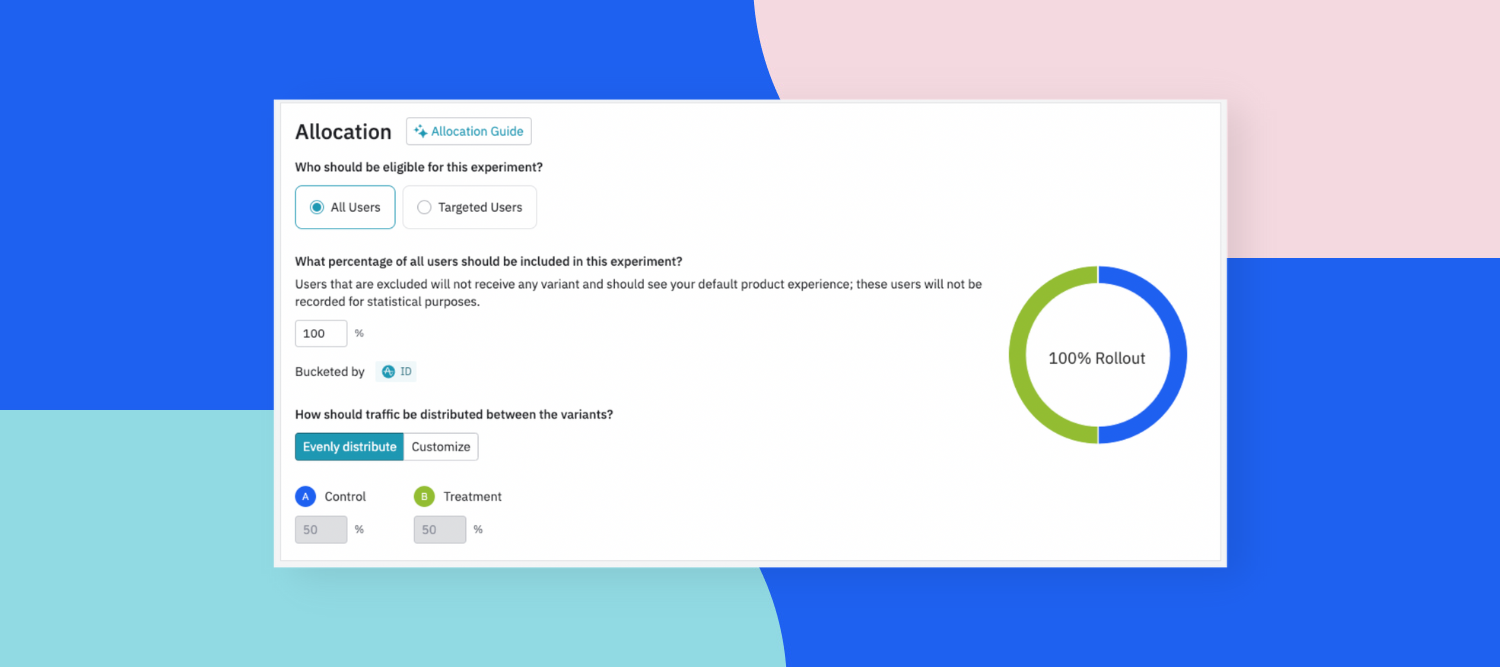
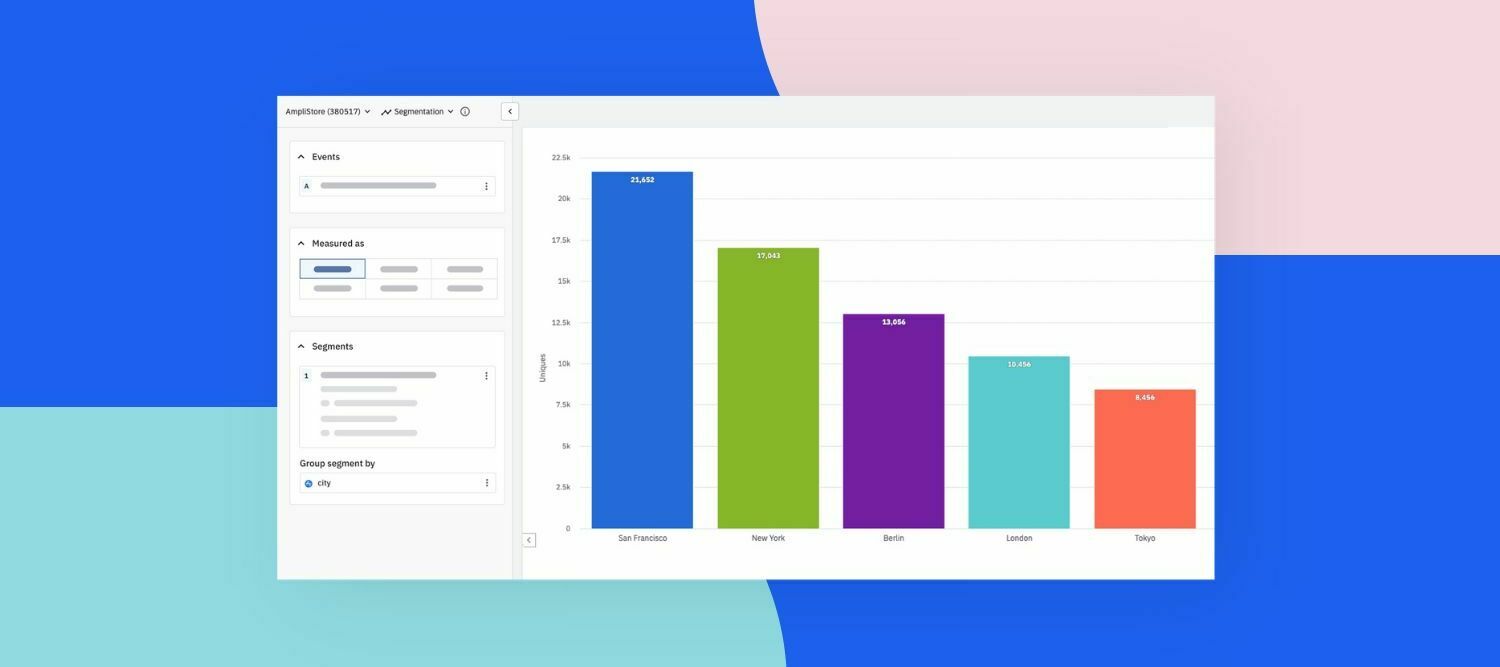
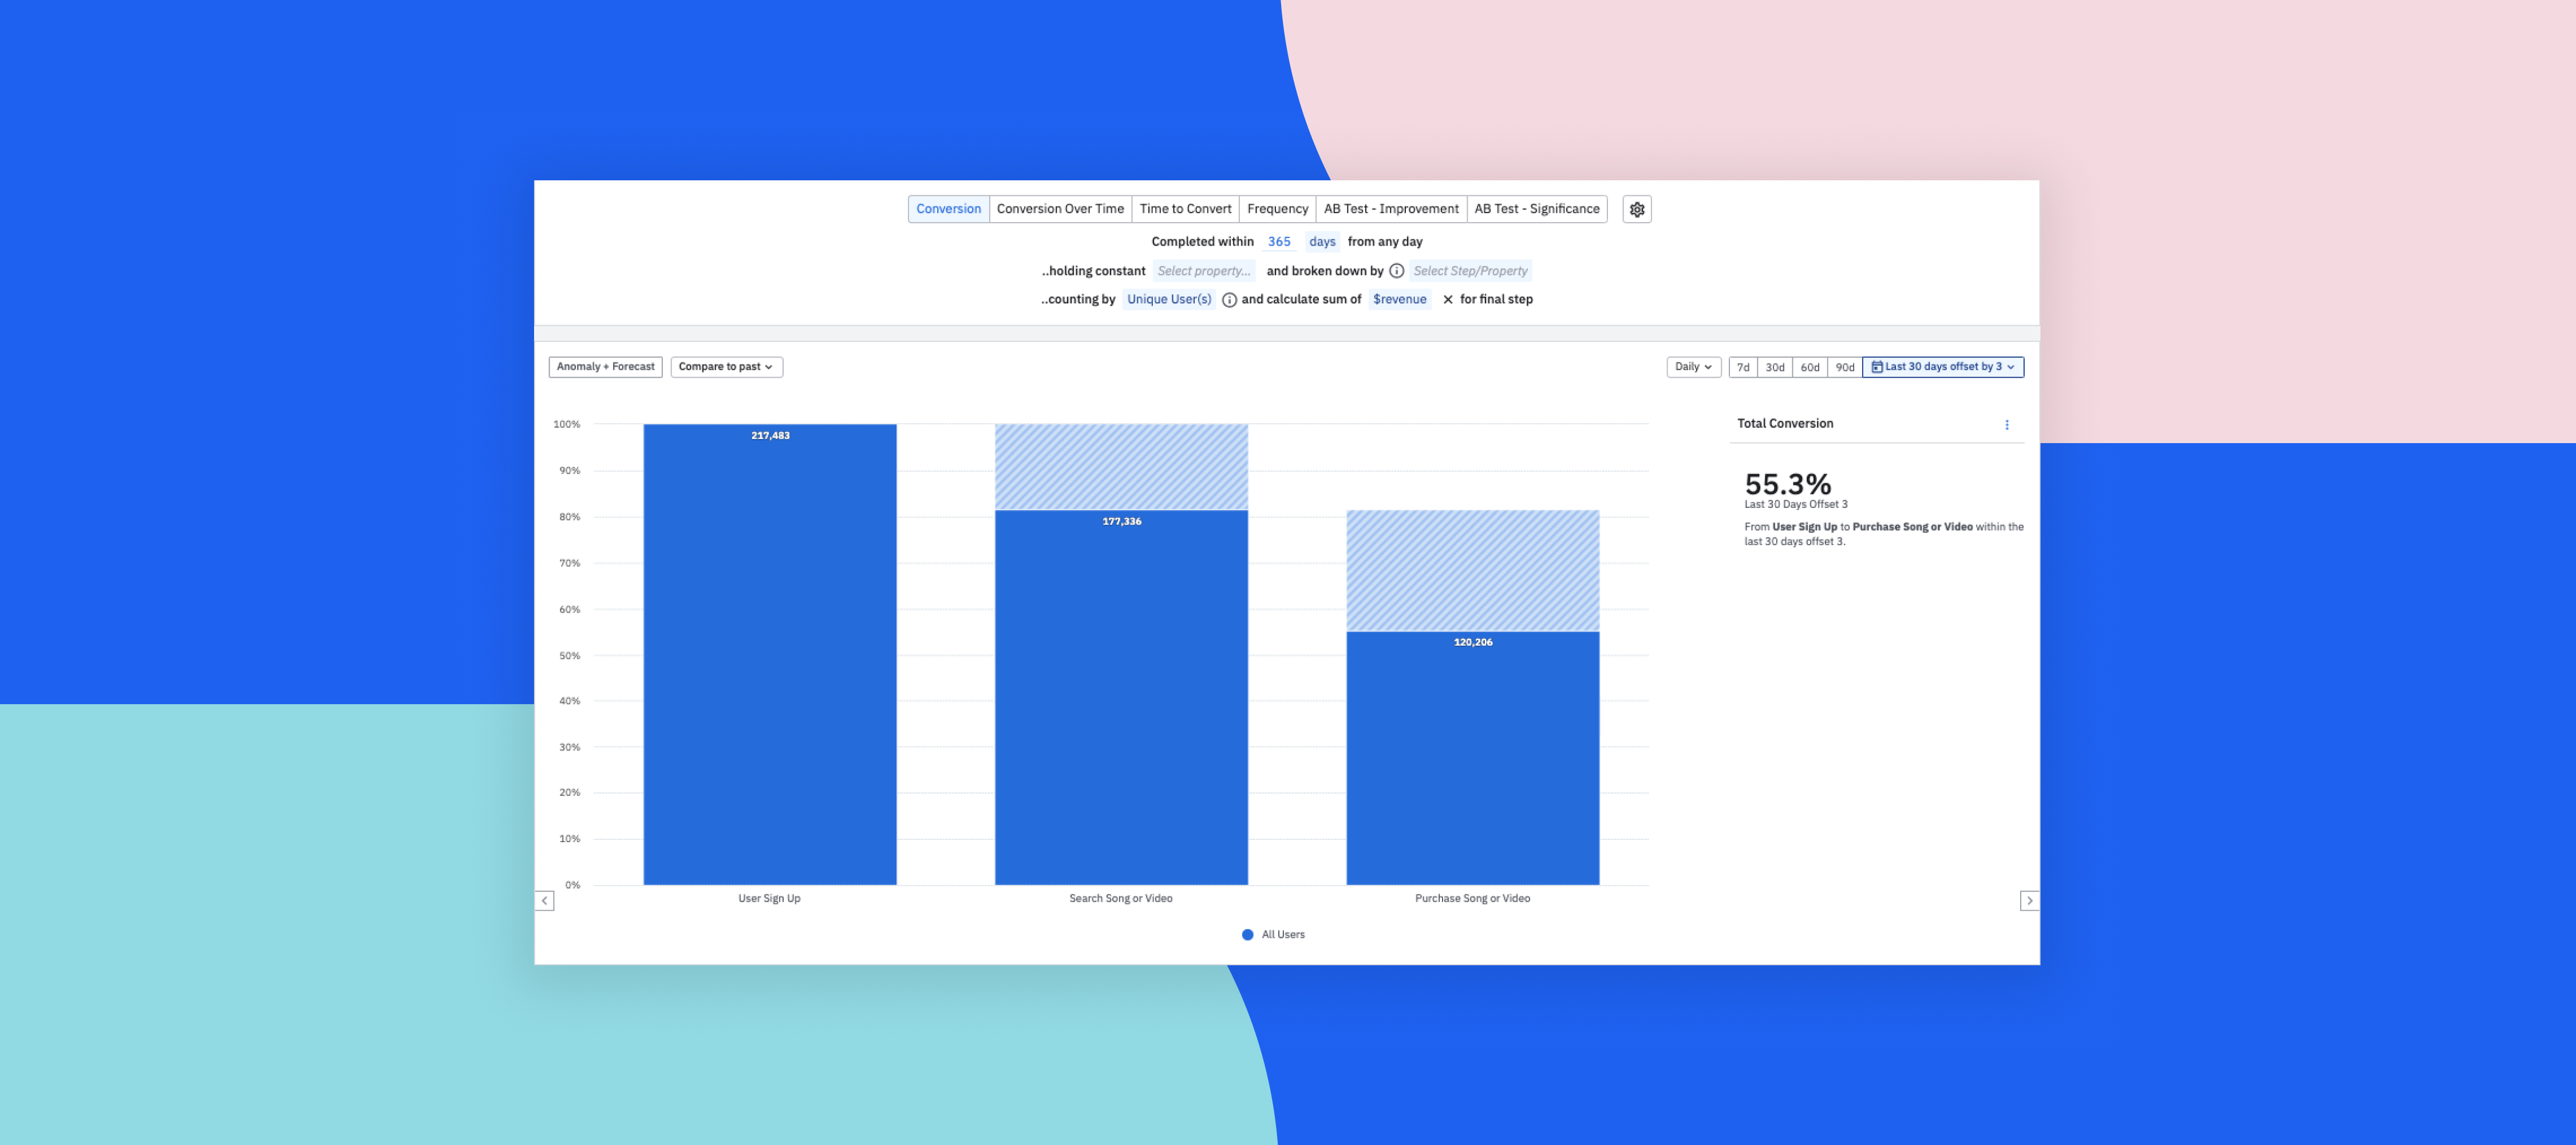
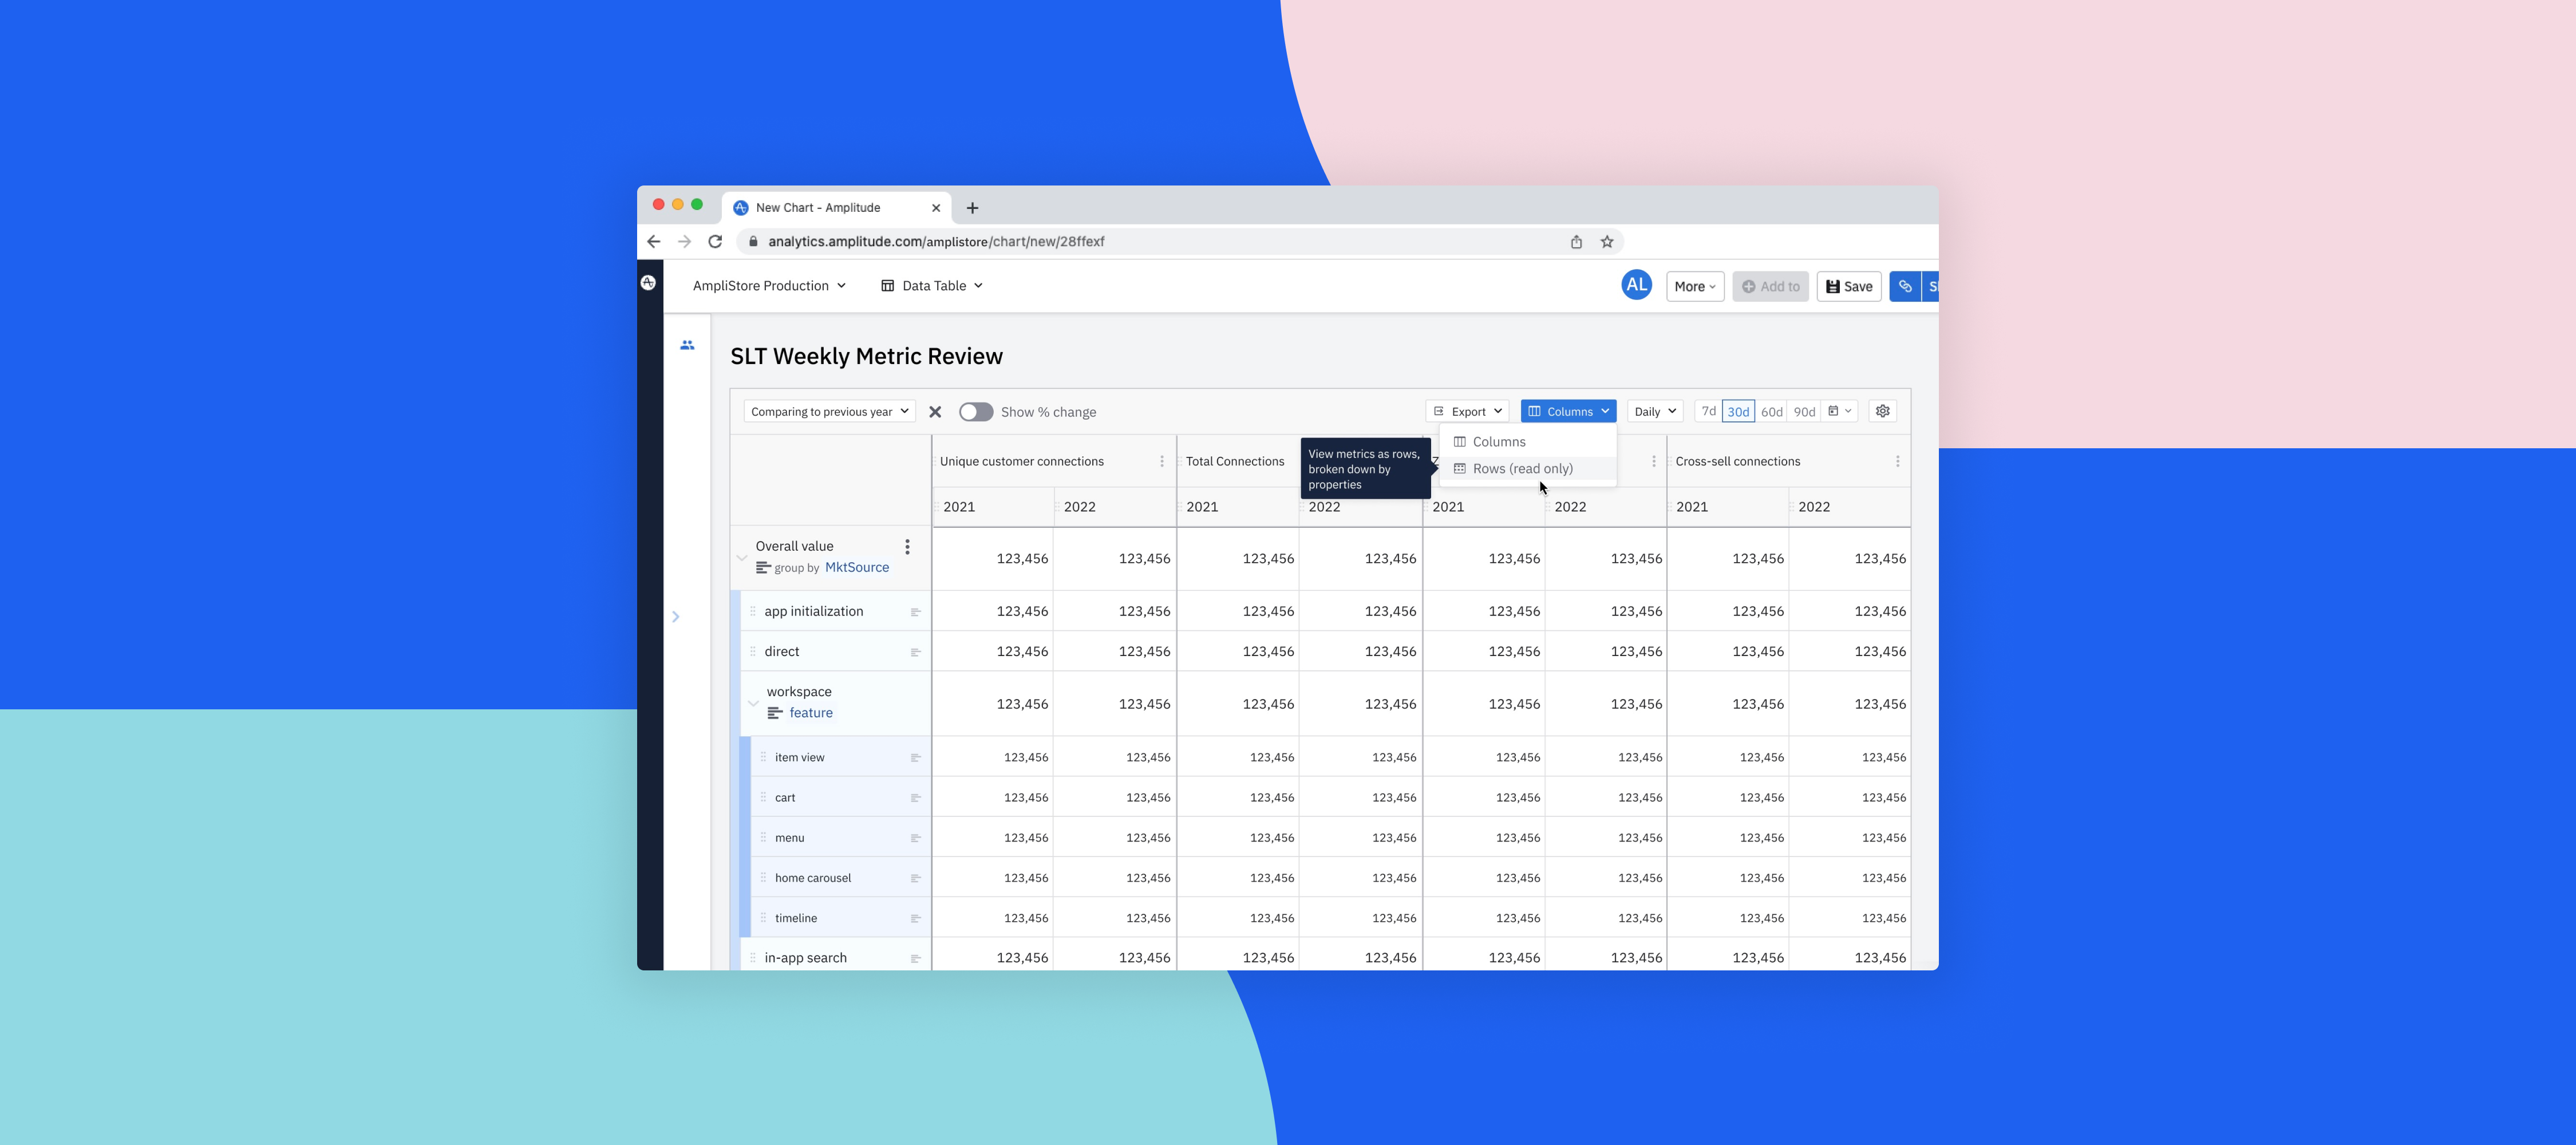
New features offer more insights, simplified workflowsAmplitude helps you see what your customers experience, understand what drives growth, and build better digital products --- all in one easy-to-use Digital Analytics Platform.This month, we’re excited to announce a slew of new updates that make the tools you love simpler – all while delivering even more insights.We’re also excited to announce #AmplitudeShipWeek! Starting December 16th, we’re bringing you seven days of new feature releases to enhance your digital analytics experience in the new year.Be sure to check back here (or follow us on LinkedIn and X/Twitter) as we reveal a new feature each day. We can’t wait for you to unwrap them all!⭐️ Updates are available on all plans and to all Amplitude customers – including the EU Data Center– unless stated otherwise. SummaryNew Analytics releasesOpt in to our new Chart insights digest [Beta]New Data & CDP releasesSimplify configuration with Bulk Model Management for Warehouse Native Update labeled events with Visual Labeling Stream export-time transformation Responsive User Profiles are now generally available Control user access with Data Permissions Profiles are now generally availableNew Experiment releasesHandle Outliers with ease using Winsorization New Analytics releasesGet clearer insights into what drives customer behavior. Amplitude Analytics gives you self-serve access to critical insights across the full customer journey. Opt in to our new Chart insights digest [Beta] You’ve got mail! This month we introduced our new insights digest – a weekly email that summarizes key metrics, trends, and new insights to explore. This optional email offers up KPIs like new signups, retention, WAUs, and session length – and then highlights data from the most-viewed charts in your org. With a simple opt-in, you’ll get the most important insights delivered right to your inbox! 🔓 Access: Users can opt in/opt out via the notifications page in settings⭐ ️ Availability: This feature is available to plus, growth, enterprise analytics customers. Note: This feature is not yet available to EUDC. New Data releasesGet trusted data to power insight about your product. Amplitude helps you proactively manage and govern your data. Simplify configuration with Bulk Model Management for Warehouse NativeGood news! Amplitude now supports the ability to bulk create and update data models in Warehouse Native. Before, customers with hundreds of tables would have to manually navigate the UI and configure each model before import. But with bulk model management, users can now configure all their models with the upload of a single YAML file.Learn more about Warehouse Native Bulk Model Management.🔓 Access via the data model management page for warehouse native. Update labeled events with Visual Labeling This new feature allows users to update their labeled events by launching the visual labeling tool. Now, users can easily update and repair labeled events as their site changes by visually selecting items or manually updating the labeled event definition.🔓 Access via Data > Events > Labeled Events > Select an event to update > Right Side panel. Stream export-time transformationAs of this month, Amplitude allows customers to stream pre-existing transformed events and event properties. This includes support for Custom Events, Derived Properties, Transformed Events, and Transformed Properties. Previously, only raw data could be streamed, but with this new feature, customers can select any existing transformations made in Amplitude taxonomy when setting up their streaming configuration. Learn more about streaming transformations.⭐️ Availability: This is a paid feature for customers on the PLUS/Growth/Enterprise plans. Customers need to be on these plans to create the corresponding transformations before streaming them out. Responsive User Profiles are now generally availableSmall screen? No problem! As of this month, the user profile page is now responsive and changes to a stacked layout on smaller screens to help improve readability of the properties. Previously, our Amp Easy layout changes caused users on smaller screens to experience troubleshooting difficulties as many of the property values were being truncated. Now, in addition to the stacked format, properties will wrap to allow for more visual space.🔓 Access this feature via Under users> User Profiles > any user profile.Control user access with Data PermissionsWith data permissions restrictions, users can limit who can perform Data Management functions. For example, you may want most of your users to have the Member role so they can create dashboards and charts, but limit custom event creation and other data management features to managers or administrators. 🔓 Access this feature via the Permissions tab.⭐️ Availability: this feature is available to Enterprise customers only. Profiles are now generally availableReady for more expansive analysis? Profiles enable customers to enrich their existing behavioral data with new dimensions from Snowflake or Databricks. This feature works regardless of the event ingestion source, as Profiles match based on user id, and allow you to sync new dimensions. This empowers users to create deeper analyses without worrying about the availability at event time.Bonus points? Profiles leverage Change Data Capture (CDC) to insert, update, and delete to maintain the current version of the data on a regular interval. 🔓 Access this feature via Data > Sources > Add Source > Profiles.⭐️ Availability: This feature is available to Growth and Enterprise customers.Learn more about profiles. New releases for Feature & Web ExperimentationDrive faster action from crystal clear test results. Amplitude helps you test, analyze, and optimize your product and web experiences at scale. Handle outliers with ease using WinsorizationOne challenge that experimentation programs often face is managing outliers in their experiments. Outliers can skew results, so it's important to have solutions to reduce their effects. With our new Winsorization feature, enterprise experiment customers can now seamlessly manage outliers in just a few clicks. (Note: Max Winsorization supports all metric types except uniques, funnel uniques, and retention.)Learn more about finding and resolving outliers in your data.⭐️ Availability: this feature is available to Experiment Enterprise customers. You’re all caught up! Here’s what’s next…Sign in to your Amplitude account to start using these new features. (Need an account? Start using Amplitude for free.) Subscribe to product updates from our Community to stay up-to-date with the latest releases. Let us know which update you’ve been waiting for in the comments.