June Platform Release Highlights
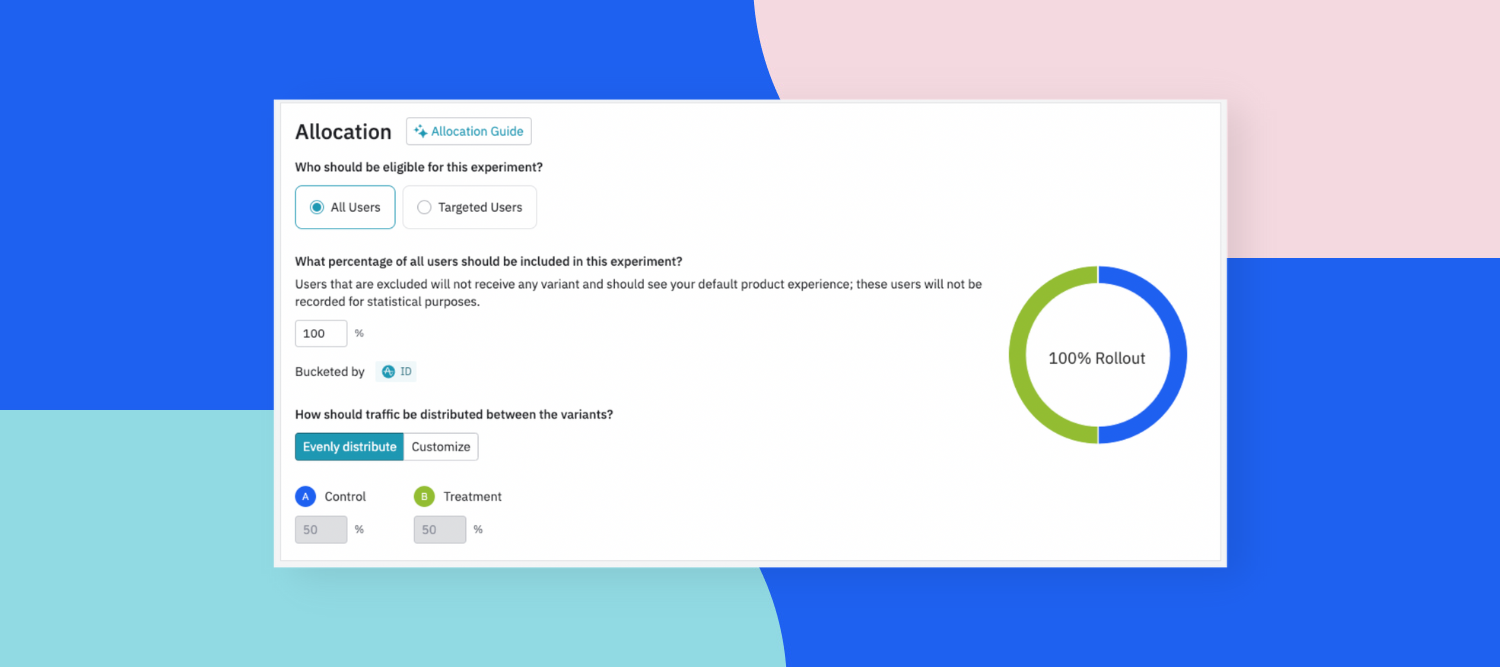
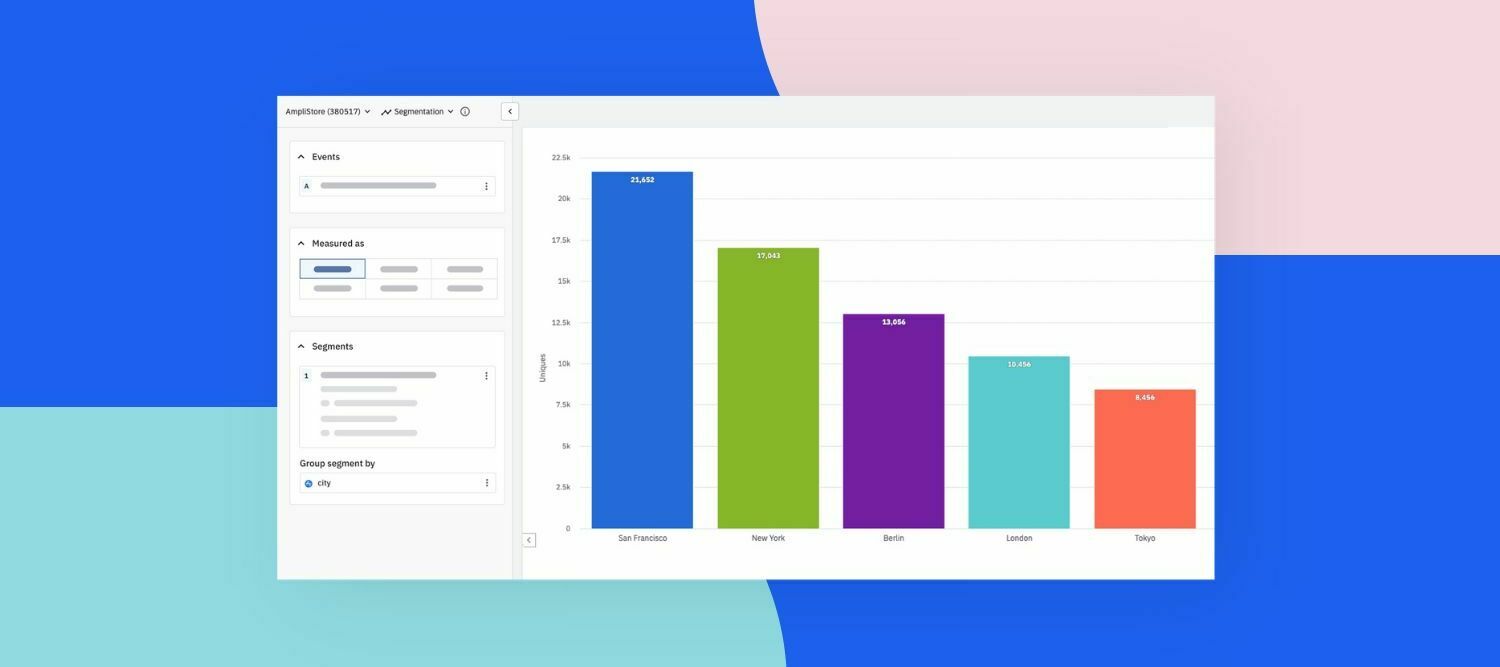
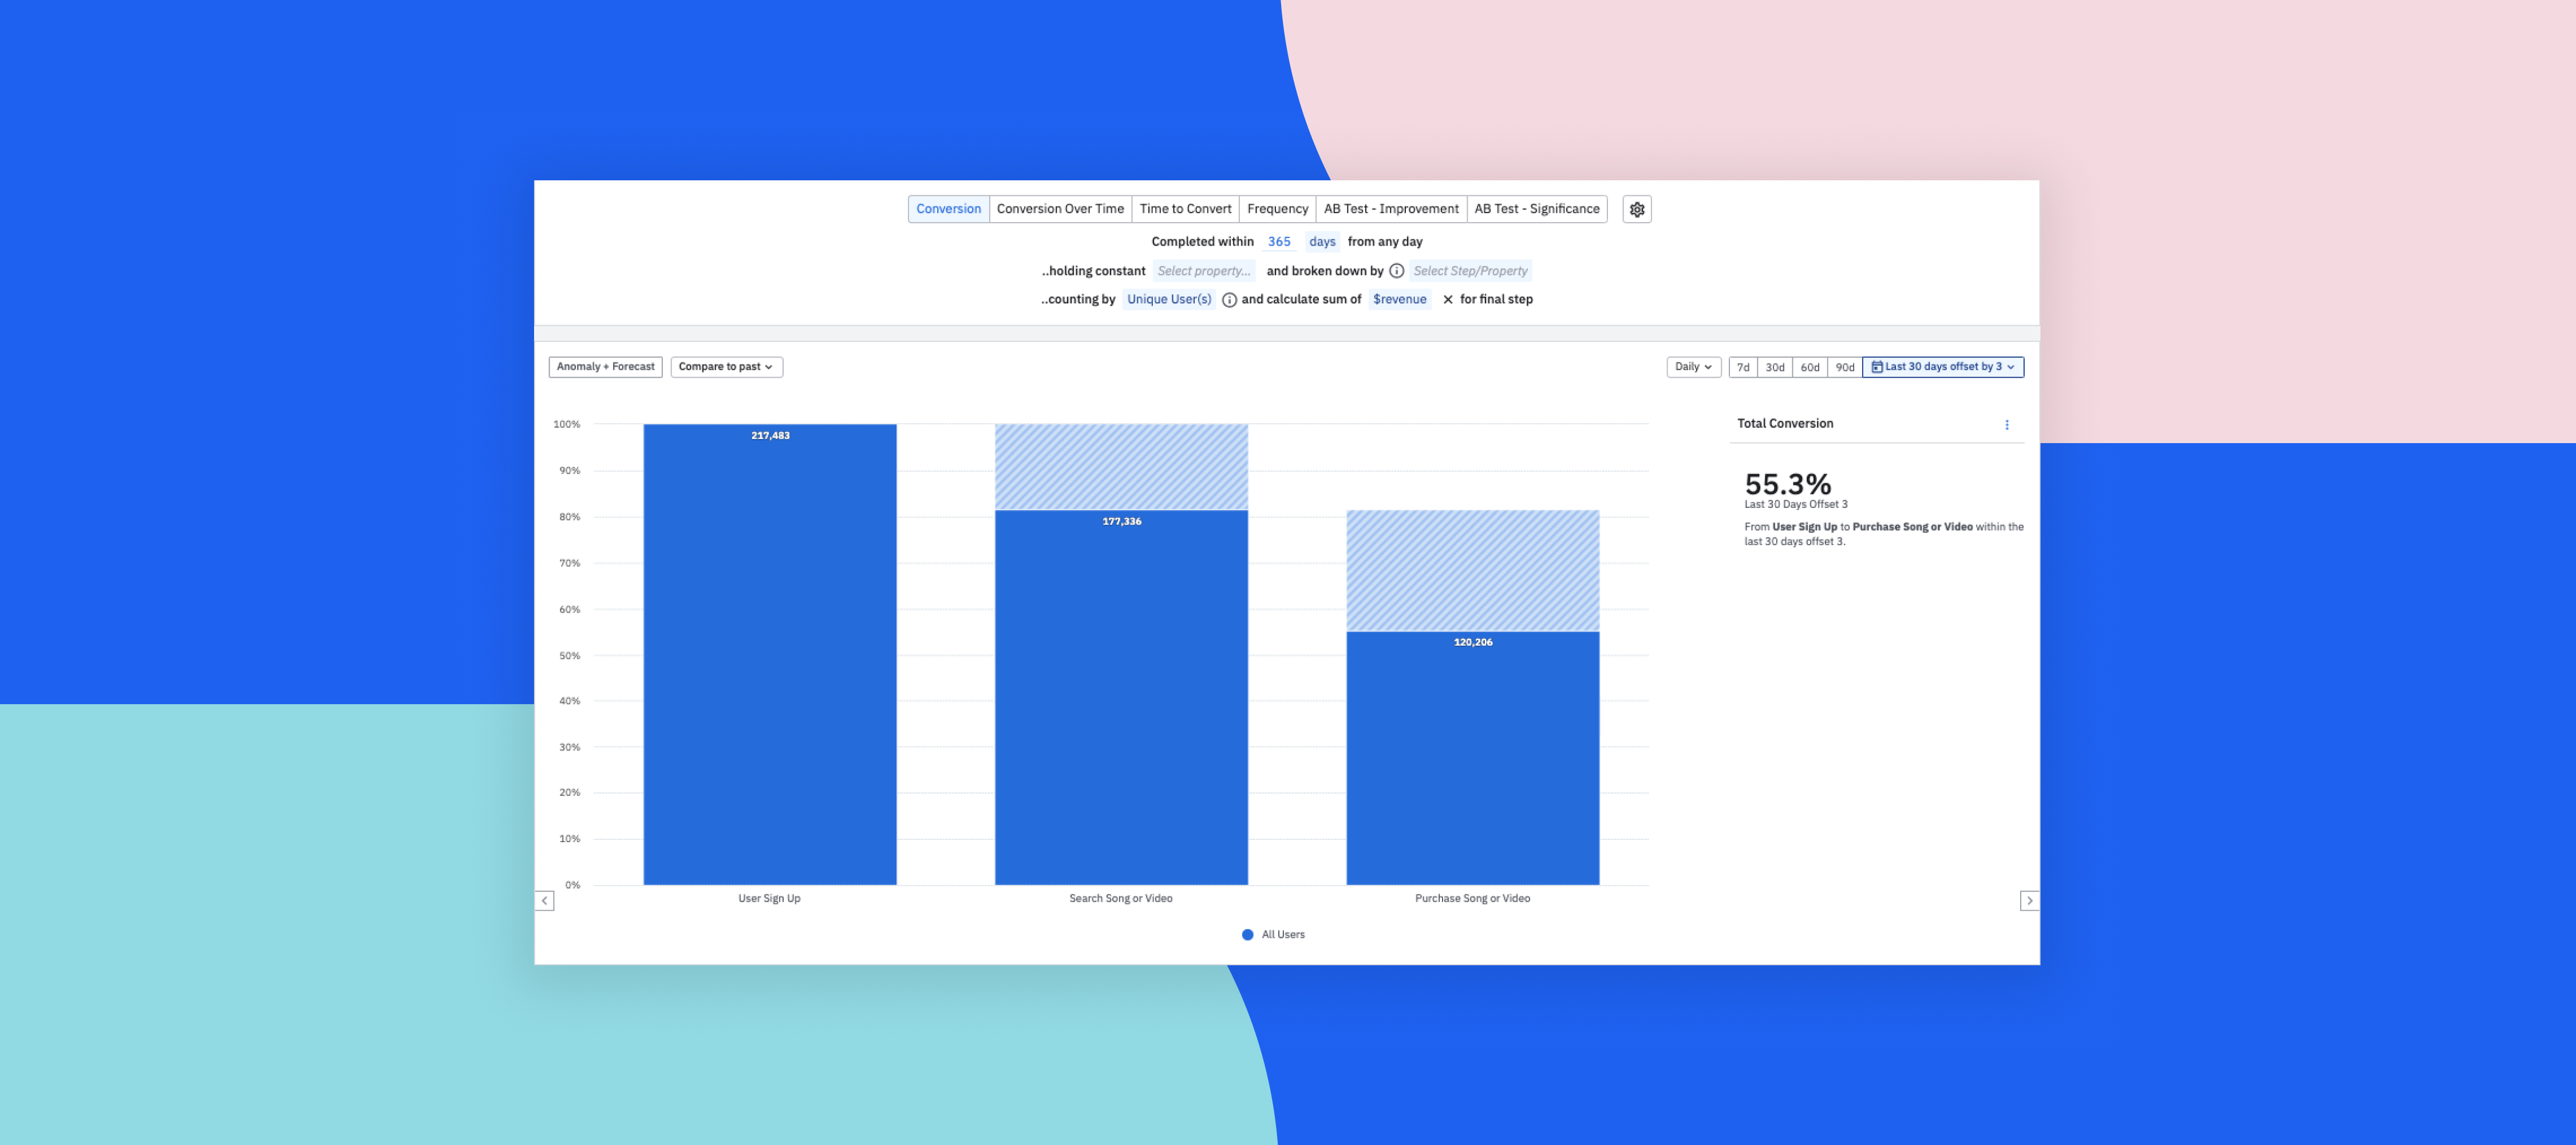
New features make data setup faster, easier than ever beforeAmplitude helps you see everything customers do, understand what drives growth, and build better digital products --- all in one easy-to-use Digital Analytics Platform.With our latest batch of feature releases, Amplitude is focused on ease. Many of your favorite features now have templates, one-click setups, or simplified workflows. Highlights include new streaming integrations, Cohort templates, Experimentation prerequisites, and more!⭐️ Updates are available on all plans and to all Amplitude customers – including the EU Data Center– unless stated otherwise. SummaryNew Analytics releasesSession Replay Updates: New Admin UI + SDK Privacy ConfigurationsNew Data & CDP releasesEnjoy HubSpot streaming integration V2 [Closed beta] Easily build Cohorts using 3 OOTB Predictive templates Map property values with Lookup TablesNew Experiment releasesDrill deeper with Feature Flag and Experiment Prerequisites New Analytics releasesGet clearer insights into what drives customer behavior. Amplitude Analytics gives you self-serve access to critical insights across the full customer journey. Session Replay Updates: New Admin UI + SDK Privacy Configurations We are pleased to announce the addition of a new privacy configuration section in the Session Replay Admin UI! This update enables users to modify the masking level and create custom masking rules using CSS selectors directly via the UI. Along with this feature, we’re also updating our SDK versions to support these configurations. This feature helps users more easily set up their Session Replay privacy settings to configure masking levels and masking rules that adhere to their business needs and standards.Learn more about Session Replay in the developer center.🔓 Access this feature under Organization Settings⭐️ Availability: This feature is now available on all plans in USDC and EUDC if your org is on a new plan and has Session Replay out-of-the-box OR your org has purchased the Session Replay Add-On. New Data releasesGet trusted data to power insight about your product. Amplitude helps you proactively manage and govern your data. Enjoy HubSpot streaming integration V2 [Closed beta]Good news! Our updated HubSpot event streaming integration leverages HubSpot’s new event definitions API to radically simplify the setup. As of this month, we now automate the replication of their event and property schemas in HubSpot, taking what was previously hours of challenging setup in HubSpot to a single click in Amplitude.Learn more about Hubspot event streaming V2⭐️ Availability: This feature is in Closed Beta and is in active development. Email integrations@amplitude.com for more information.Easily build Cohorts using 3 OOTB Predictive templates This month, we’re excited to help users get more out of Cohorts with the introduction of three new Predictive templates: Likely to Churn, Likely to Upgrade and Likely to Abandon Form.These templates are enabled with out-of-the-box Amplitude events and user properties, making it easier than ever to identify at-risk or high-opportunity customers. With this update, we’ve removed the friction of building a cohort from scratch, and empowered users to get value from their predictive cohorts with only one click.Learn more about Predictions with these resources:Build a prediction Use prediction-based cohorts in your campaigns Define a new cohort🔓 Access this feature from the Create menu -> Cohorts -> Predictive tab.⭐️ Availability: This feature is available to CDP Growth and CDP Enterprise plans.🚫 Note: Not available in EUDC Map property values with Lookup TablesLookup Tables allow customers to map property values in Amplitude to values in any uploaded CSV. This means customers can augment data already sent into Amplitude at query time, without having to send it in during ingestion. With the latest update, we’ve made several improvements, including:Revamped Creation and Edit UI – The multi-step UI has been simplified into a single step, making it easier to understand the data contained within a Lookup Table in Amplitude Partial Uploads – Instead of having to upload all the data every time you want to upload your Lookup Table, we now support partial updates, which will merge into the table in Amplitude Better Error messages in UI and API during creation, edit, and deletion. Brand New API - Learn more about Lookup Table API 2 As well as full portfolio support.🔓Access Lookup Tables in the Sources page in Data, and Lookup Properties in the Property Library. New Experiment releasesDrive faster action from crystal clear test results. Amplitude Experiment helps you test, analyze, and optimize your product experiences at scale. Drill deeper with Feature Flag and Experiment Prerequisites As of this month, Amplitude Experiment now allows users to create dependencies for flags and experiments on prerequisite flags or experiments. This update increases the flexibility of your experimentation program, enabling users to target flags based on a previous allocation. This is a particularly useful capability for advanced cases like packaging tiers or entitlements. Now, users can create a package-level flag and make a set of capabilities dependent on this new flag being turned on for a set of customers. This unlocks much more flexibility and control for engineering teams.Learn more about Flag Prerequisite in Amplitude. 🔓 Access The Dependencies card below the Overview card for experiments and below the Settings card for flags.⭐️ Availability: This feature is available to enterprise customers You’re all caught up! Here’s what’s next…Sign in to your Amplitude account to start using these new features. (Need an account? Start using Amplitude for free.) Subscribe to product updates from our Community to stay up-to-date with the latest releases. Let us know which update you’ve been waiting for in the comments.