Solved

Chart API does not return series labels


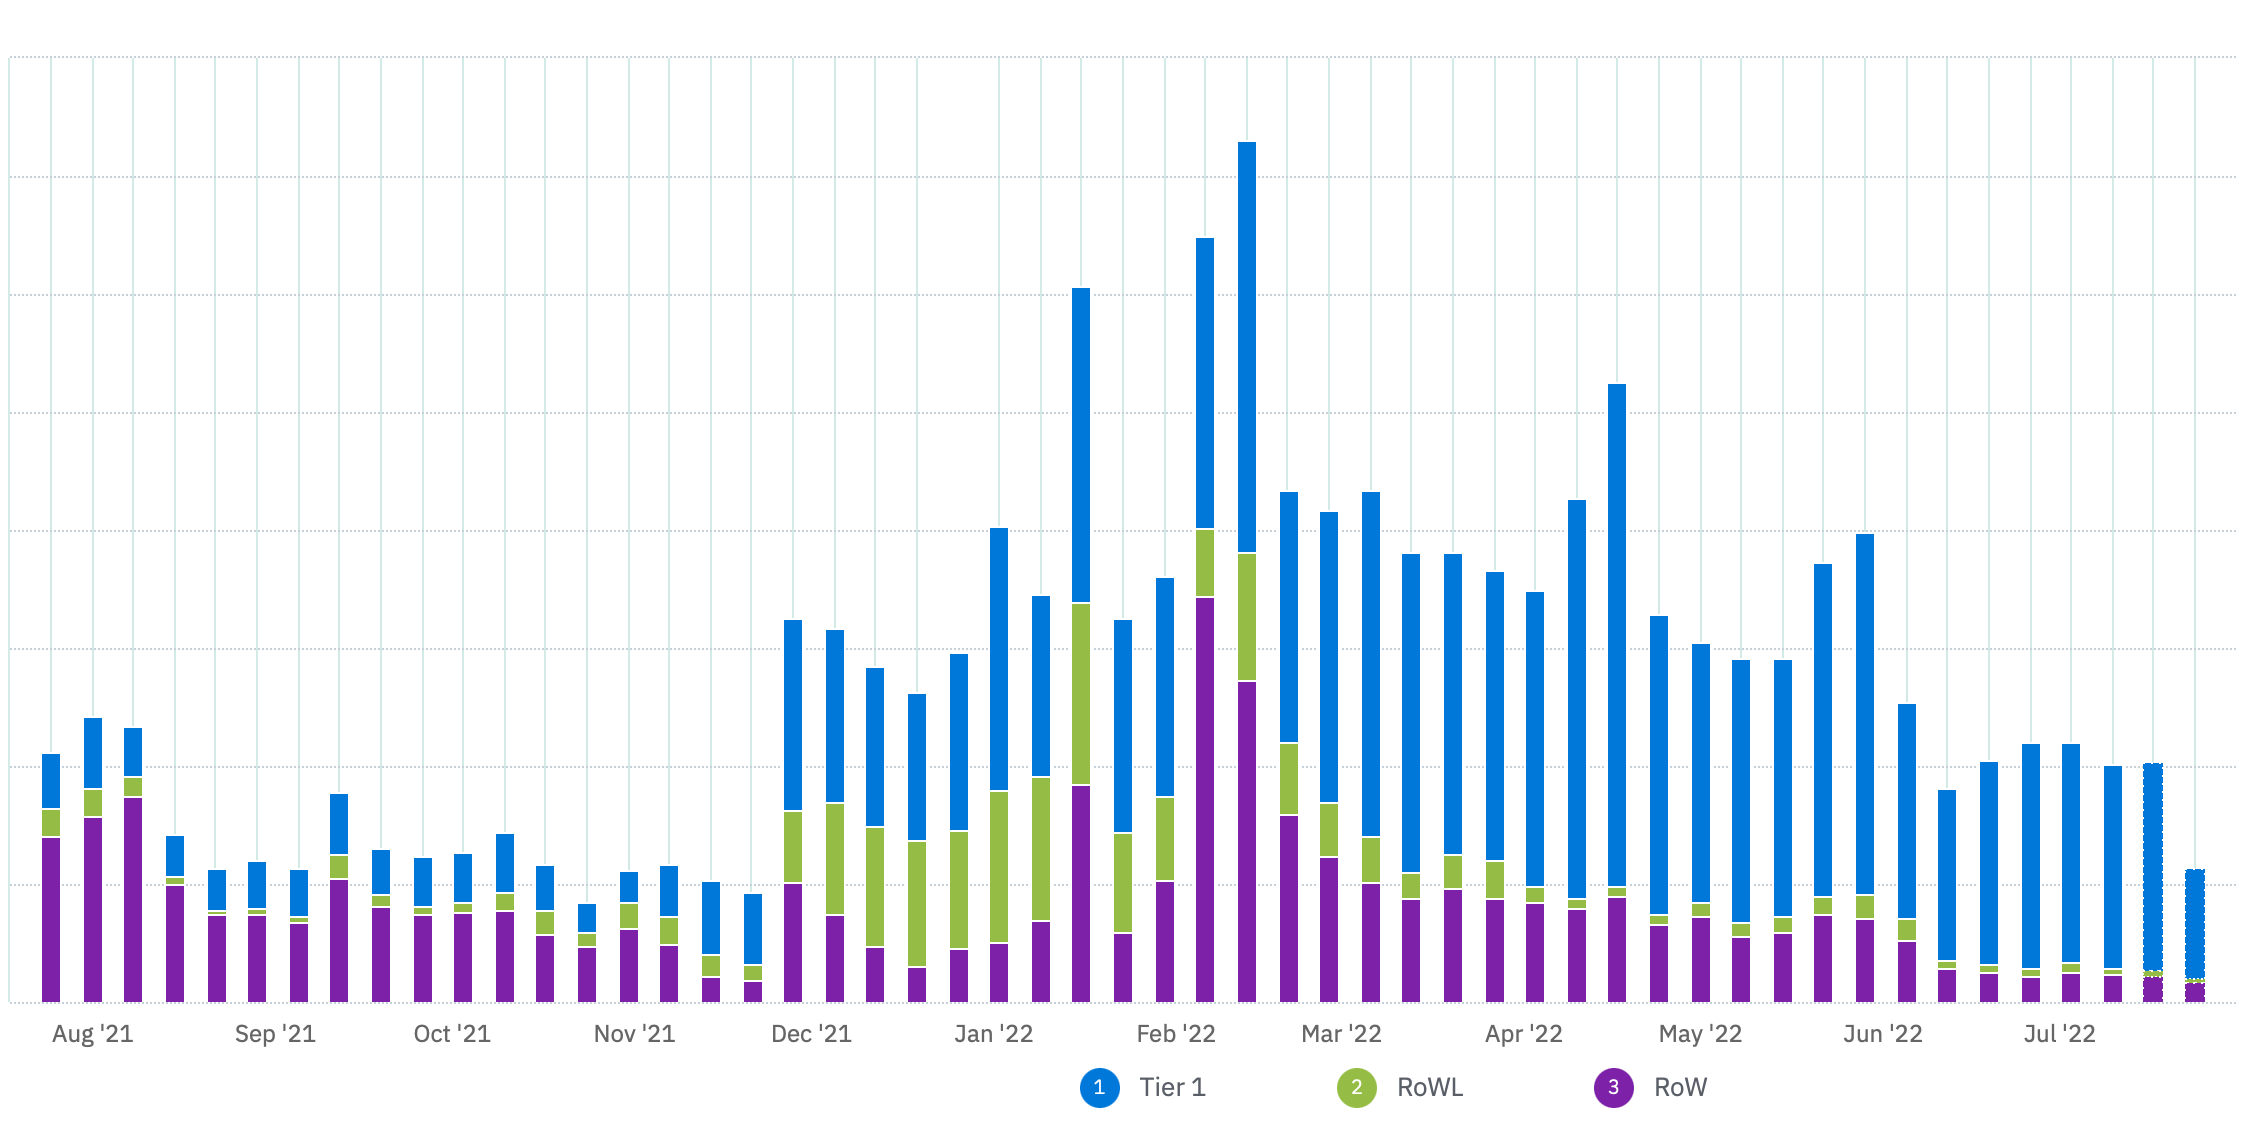
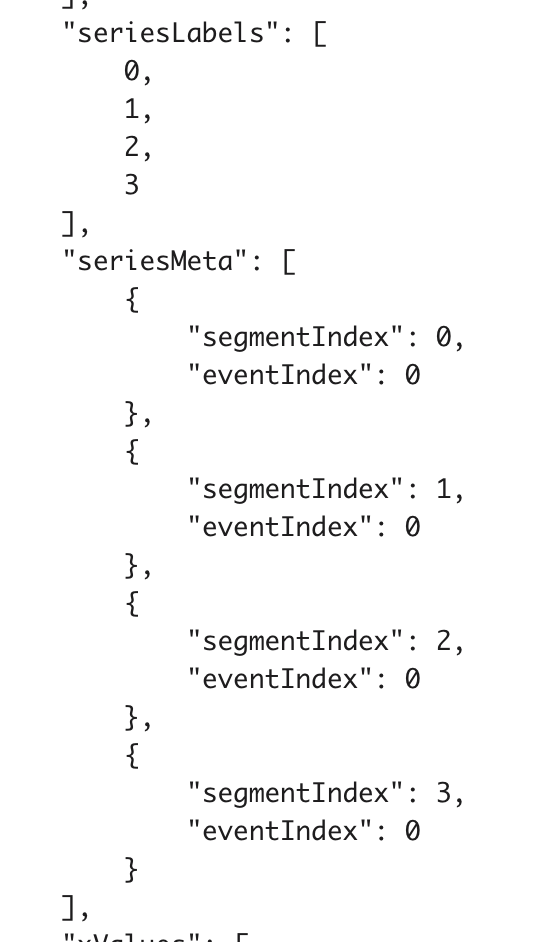
I have integrated with the get chart API GET /api/3/chart/:chart_id/query however the response returns the series labels as 0,1,2,3 and not the labels that I see when viewing the chart. This means I don’t know what the data refers to when using the API. Is this the expected behaviour?

Response:

"seriesLabels": [0,1,2,3]

Is there an alternative way to automate the retrieval of csv exports that are available when manually viewing a chart?

Best answer by Saish Redkar

Hey @Danny 

Can you elaborate which type of chart and view are your trying to query via this endpoint?

Usually from an event segmentation chart perspective, the group by property values are listed under “seriesLabels”.

Re.the automated csv export, that is not supported currently. You can try putting this in front of the product team by submitting this as a feature request.

View original
Did this topic help you find an answer to your question?

5 replies

Saish Redkar
Expert
Forum|alt.badge.img+10
  • Expert
  • 1378 replies
  • Answer
  • July 27, 2022

Hey @Danny 

Can you elaborate which type of chart and view are your trying to query via this endpoint?

Usually from an event segmentation chart perspective, the group by property values are listed under “seriesLabels”.

Re.the automated csv export, that is not supported currently. You can try putting this in front of the product team by submitting this as a feature request.


  • Author
  • New Member
  • 2 replies
  • July 28, 2022

Hi @Saish Redkar thanks for the quick reply! The chart I am trying to view is a “Stacked Bar” as shown below:

The setId property is blank throughout the response, and seriesLabels and seriesMeta do not show any useful information:

I would have expected to see Tier1 RoWL and RoW?


Thanks


  • Author
  • New Member
  • 2 replies
  • August 3, 2022

@Saish Redkar I am new to these forums and I am unsure how this has been marked as solved, however in my opinion it is not solved yet. Are you able to mark it as not solved (I am still not seeing any labels) or is there a way I can do this myself? Thanks


Saish Redkar
Expert
Forum|alt.badge.img+10

Hey @Danny 

Since I’m not the forum admin, I don’t have the privileges to change that. The admin must have mistakenly marked this as solved.

Re. the issue, I tried replicating my chart versions and querying them. I found that such result is possible if your chart is using multiple user segments in the Segmentation Module i.e. on the right hand side.

The seriesLabel and seriesMeta will be populated in the api responses if the chart uses a group by on any user or event property.

Hope this helps.


This is not solved and I too need this feature


Reply


Cookie policy

We use cookies to enhance and personalize your experience. If you accept you agree to our full cookie policy. Learn more about our cookies.

 
Cookie settings