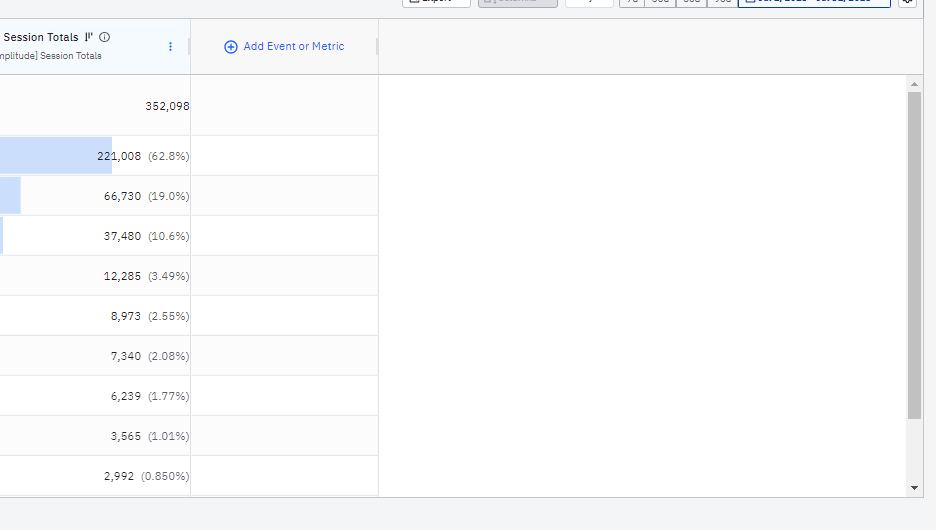
I’ve noticed that users can’t re-size data tables/charts, and if we need to see the data “below the fold” of the chart, we have to scroll down using the bar at right.
If we could instead re-size the visual to include the data below, that would be great.