Solved

User Look-Up grouped by session


I’m new to Amplitude, and would appreciate some guidance on how to build a view that lists all the user sessions.


It would be something similar to the User Look-Up screen, except it would report on sessions vs. events, and ideally I could also include a user properties in the list of selected fields.


Thanks so much!

Best answer by JennRu

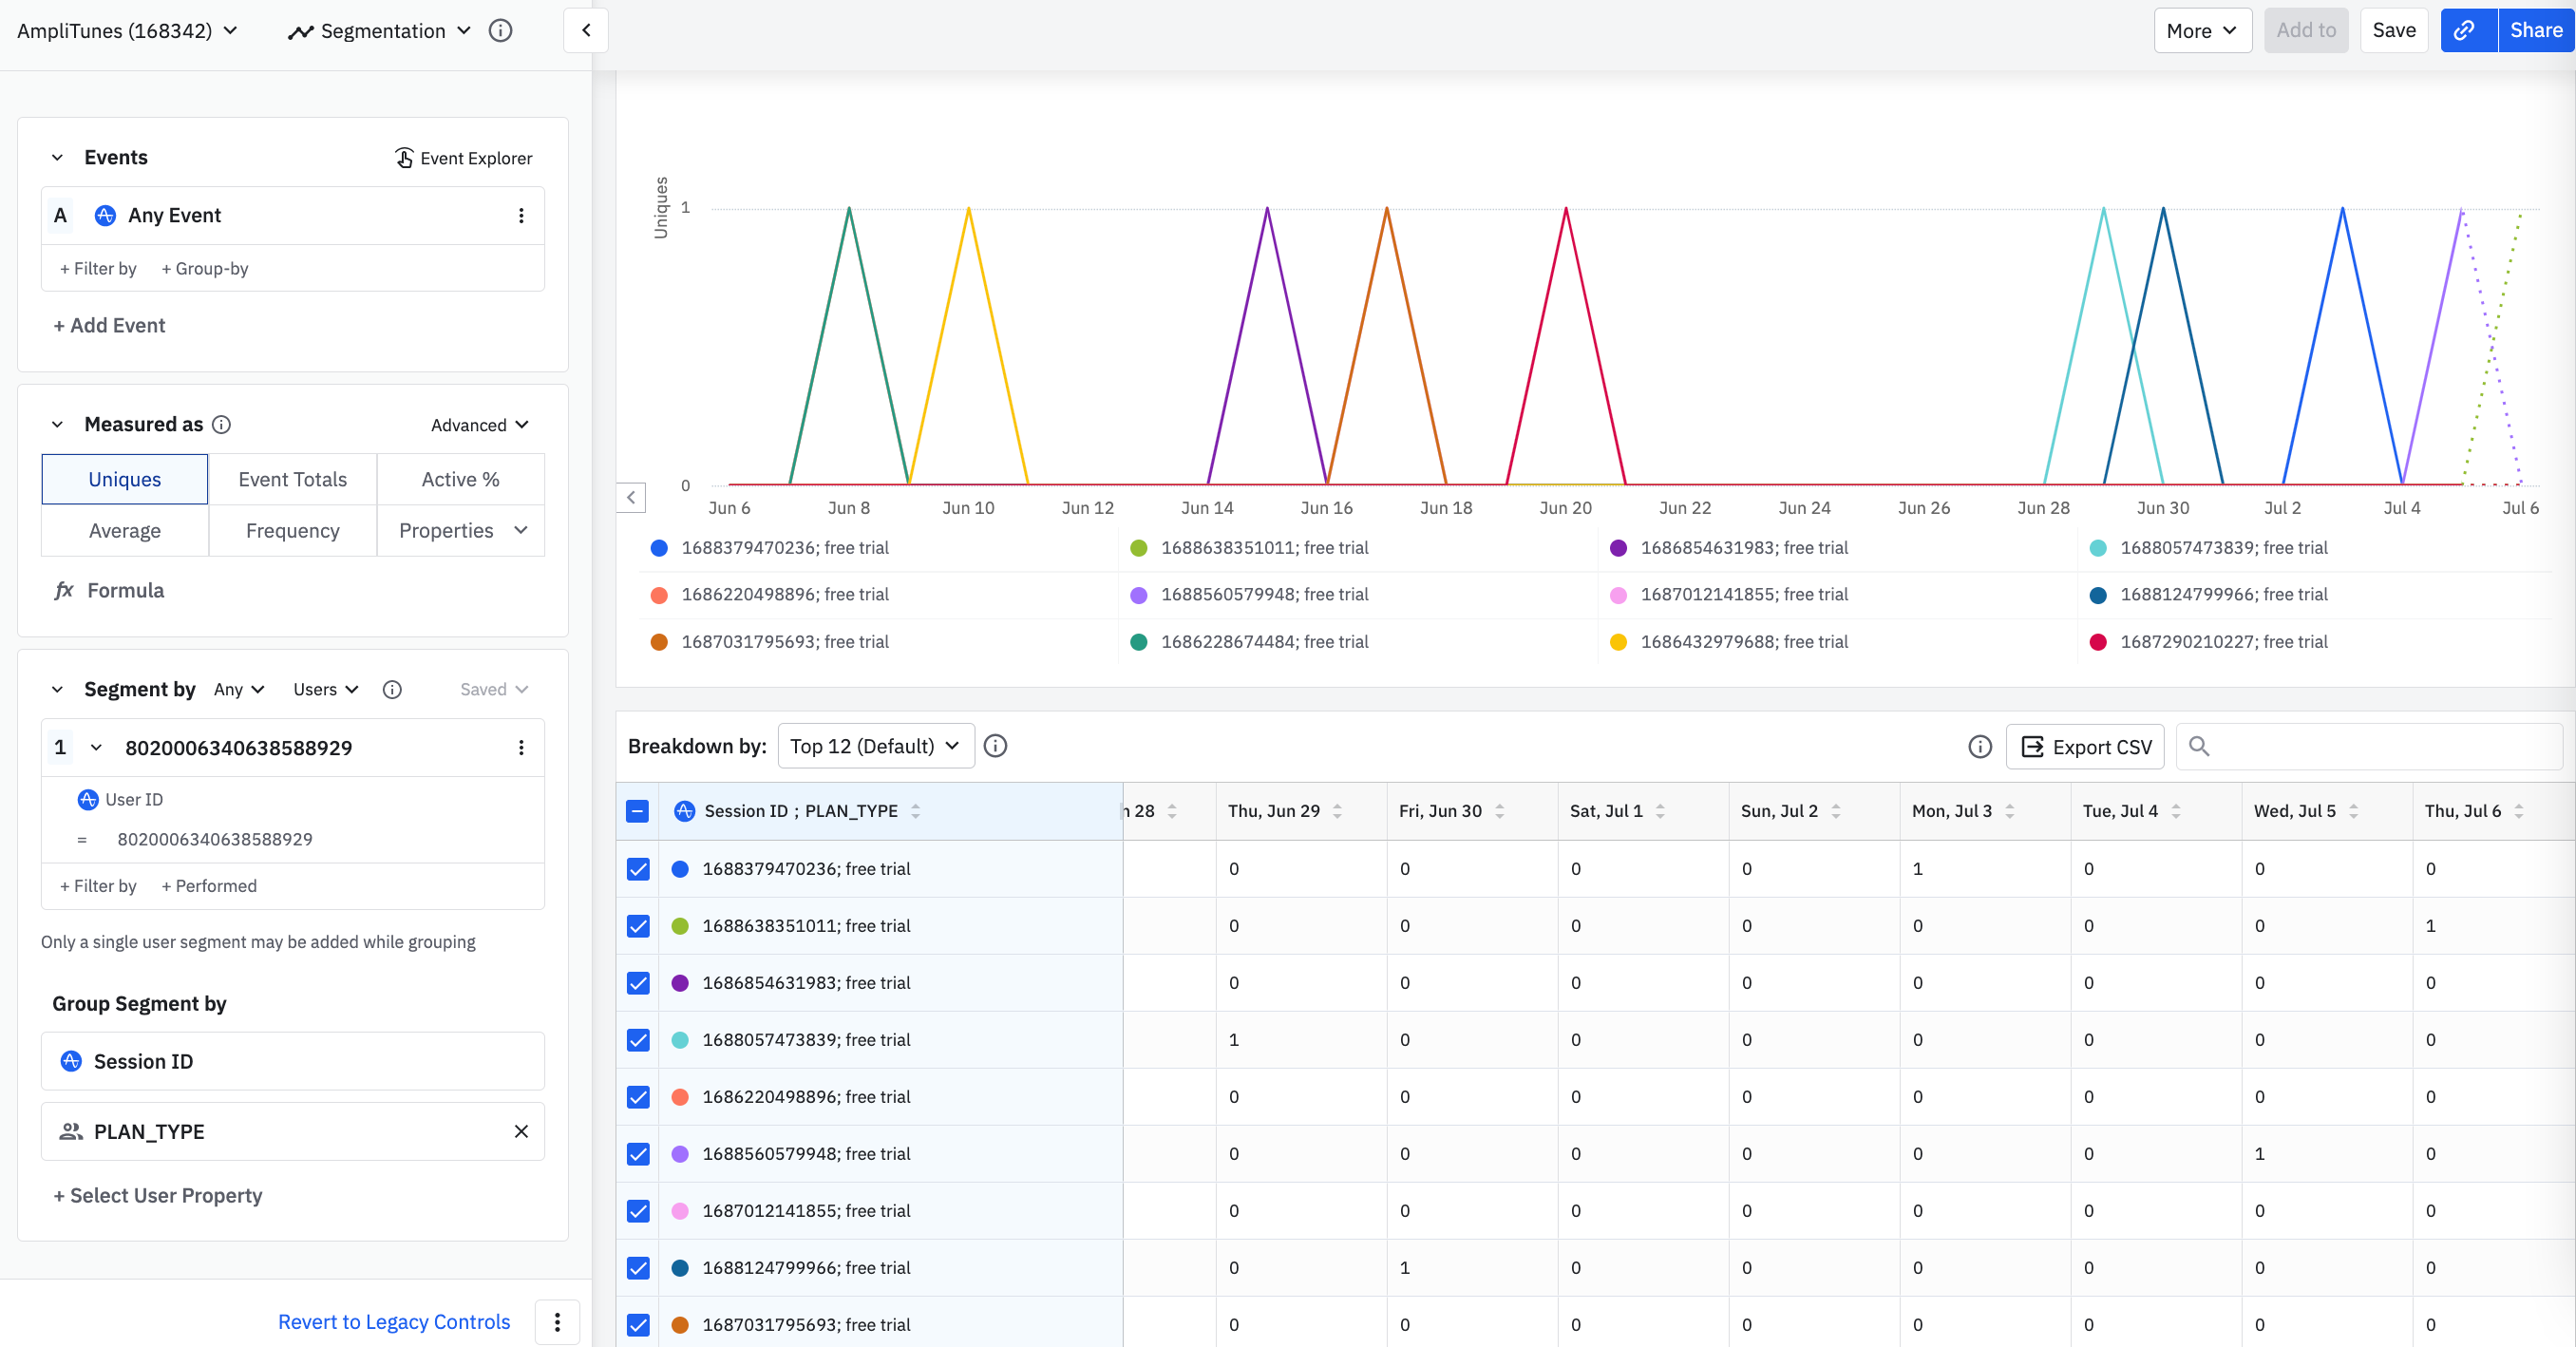
One possible alternative, depending on the scale of how you’d like to display user sessions, is you can build an event segmentation chart on Any Event, set the UserID you’re interested in looking at, and then group by Session ID, and add another group by on the user property of interest. 

You can set a maximum of 5 group by’s in a chart.

Here is a sample chart in the demo org: https://app.amplitude.com/analytics/demo/chart/new/1vcviw20


Then you may wish to export this to data into a spreadsheet, contingent on what types of data changes you’re scanning across user sessions. 


I hope this helps 

View original
Did this topic help you find an answer to your question?

2 replies

Saish Redkar
Expert
Forum|alt.badge.img+10

Hey @Spencer Hivert 

The User Lookup view is a real-time feed of the most recent 100 events Amplitude has received from your product during the last day (based on upload time).

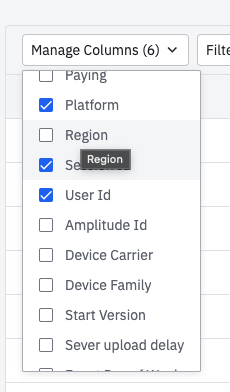
Currently, I don’t think it’s possible to use User Lookup in a session perspective manner. You can filter on the session id if needed and other default Amplitude user properties using “Manage Columns” filter, but nothing more than that. You can submit this as a feature request if required.

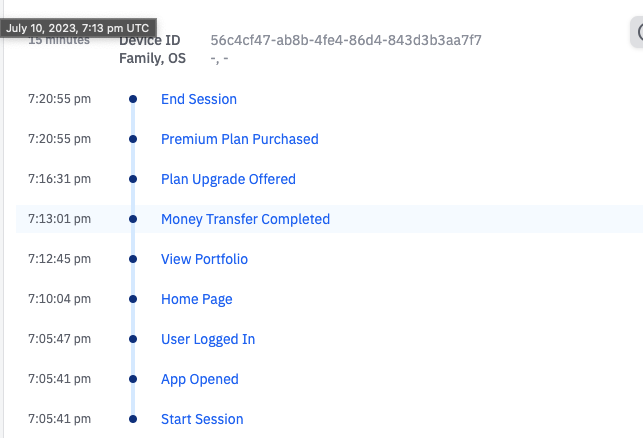
If you go over any user profile like this , you can see that the events are grouped in a session (between Start Session and End Session events ) as seen below


Let me know if this helps.


JennRu
Community Manager
Forum|alt.badge.img+9
  • Community Manager
  • 75 replies
  • Answer
  • July 6, 2023

One possible alternative, depending on the scale of how you’d like to display user sessions, is you can build an event segmentation chart on Any Event, set the UserID you’re interested in looking at, and then group by Session ID, and add another group by on the user property of interest. 

You can set a maximum of 5 group by’s in a chart.

Here is a sample chart in the demo org: https://app.amplitude.com/analytics/demo/chart/new/1vcviw20


Then you may wish to export this to data into a spreadsheet, contingent on what types of data changes you’re scanning across user sessions. 


I hope this helps 


Reply


Cookie policy

We use cookies to enhance and personalize your experience. If you accept you agree to our full cookie policy. Learn more about our cookies.

 
Cookie settings