Solved

'User session' average length changes for weeks in the past

  • October 25, 2022
  • 1 reply
  • 319 views

Hey All!

I have a chart set up as the ‘user session type’ looking at avg length.

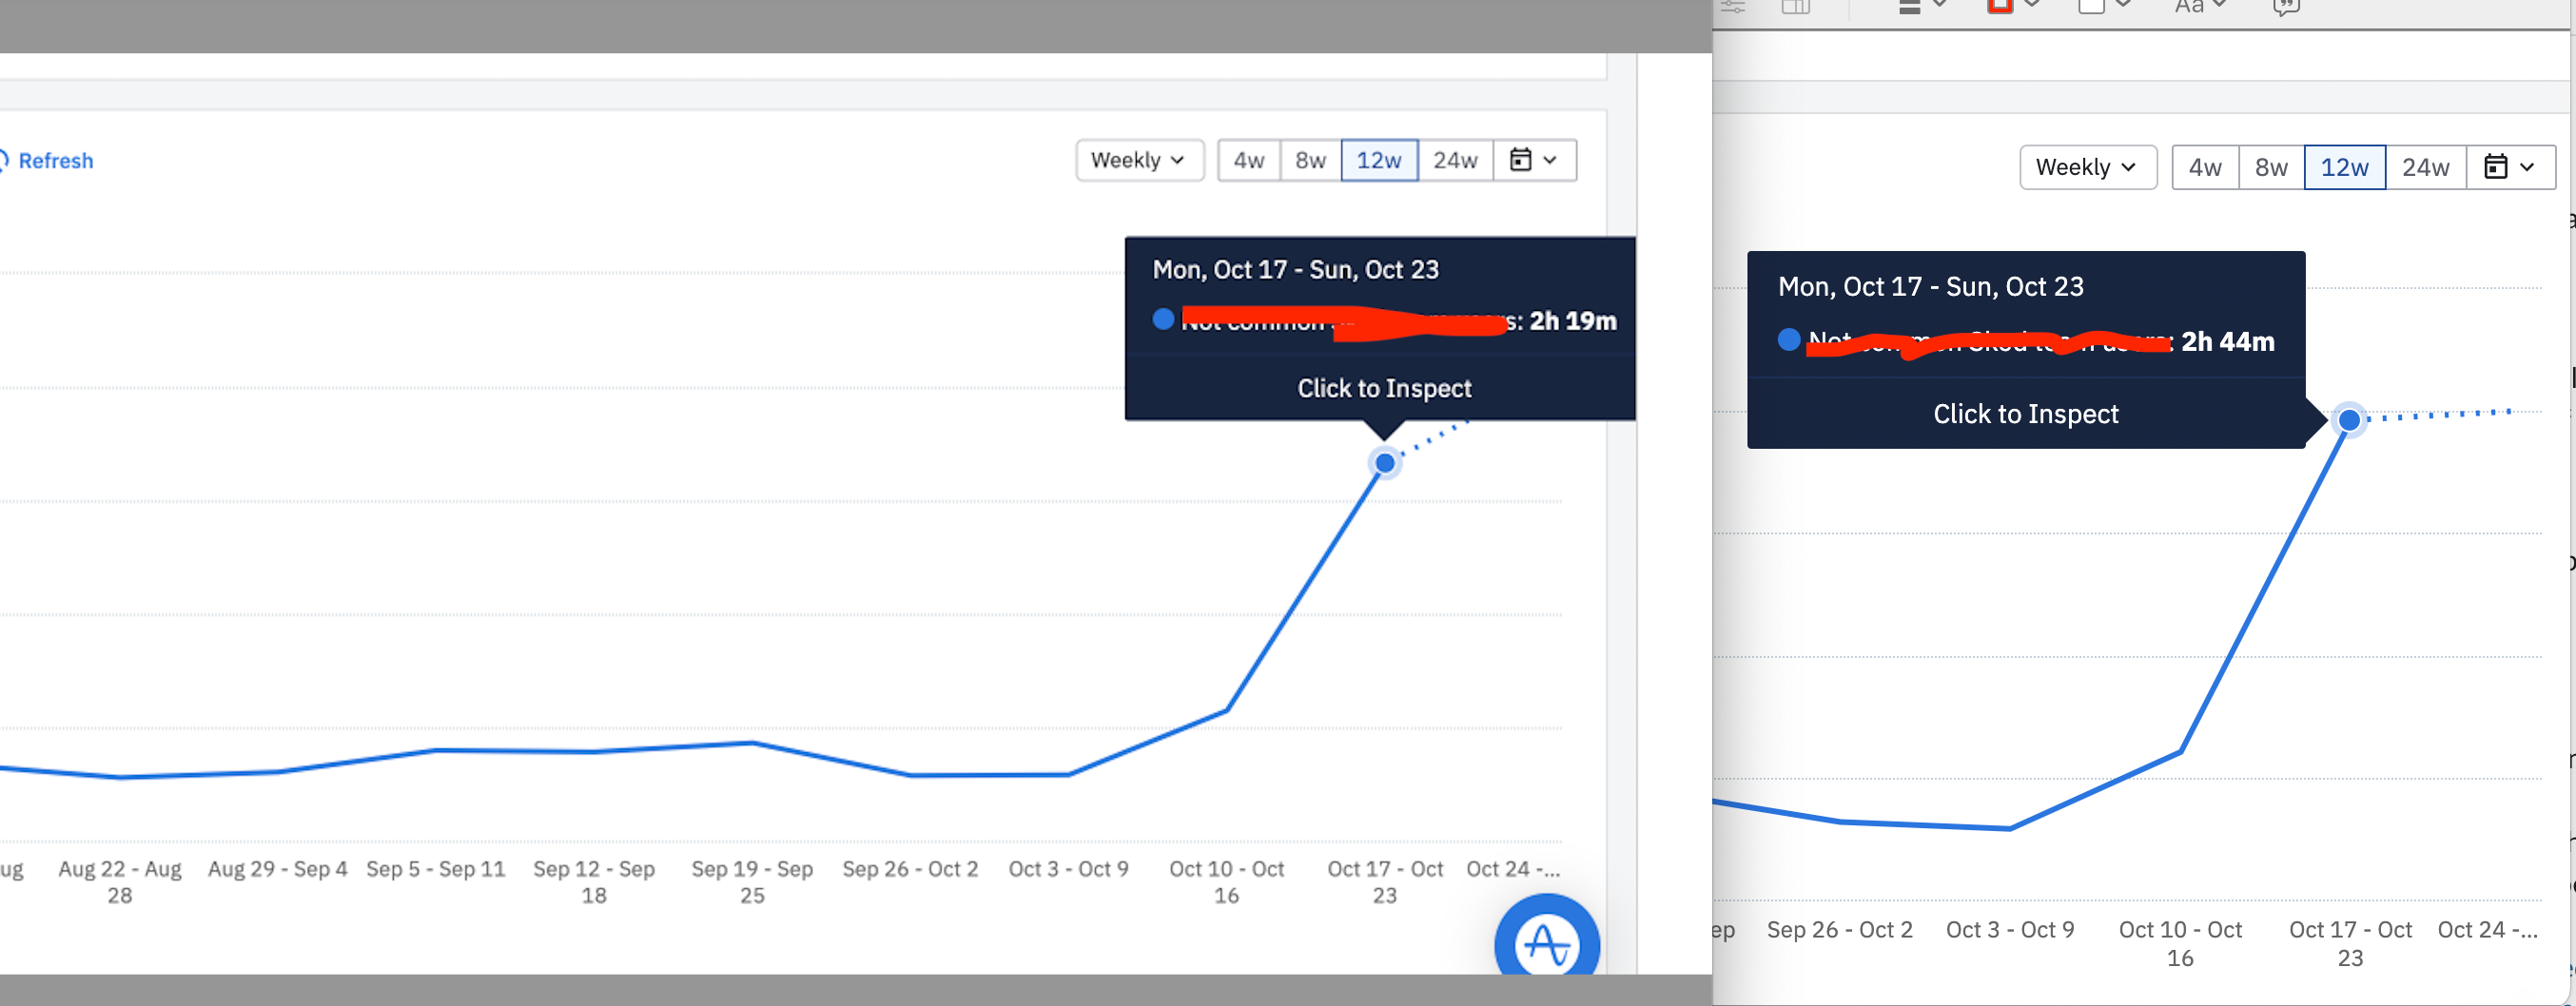
I’ve been checking this chart for a little while and some of the numbers for previous weeks seem to be changing and I’m not sure why this would be the case.

For example, two screen grabs below. One from this morning & one from this afternoon. The weeks previous to this also have changed data.

Any ideas what this could be?


Best answer by Saish Redkar

Hey @gisellegray_ 

How are your data sources setup?

It could be possible that there was some delay in data ingestion between those 2 time periods in question and some more event data got ingested between that. I also see that there is a significant uptick in the session length in comparison to the previous weeks.

I would also check if the project time zone got changed while analyzing that chart for the previous weeks. This will  rule out the possibility of some sessions falling into the next day which might cause some discrepancies.

View original
Did this topic help you find an answer to your question?

1 reply

Saish Redkar
Expert
Forum|alt.badge.img+10
  • Expert
  • 1380 replies
  • Answer
  • October 25, 2022

Hey @gisellegray_ 

How are your data sources setup?

It could be possible that there was some delay in data ingestion between those 2 time periods in question and some more event data got ingested between that. I also see that there is a significant uptick in the session length in comparison to the previous weeks.

I would also check if the project time zone got changed while analyzing that chart for the previous weeks. This will  rule out the possibility of some sessions falling into the next day which might cause some discrepancies.


Reply


Cookie policy

We use cookies to enhance and personalize your experience. If you accept you agree to our full cookie policy. Learn more about our cookies.

 
Cookie settings