I’m currently analysing retention between a few segments of my paying users.
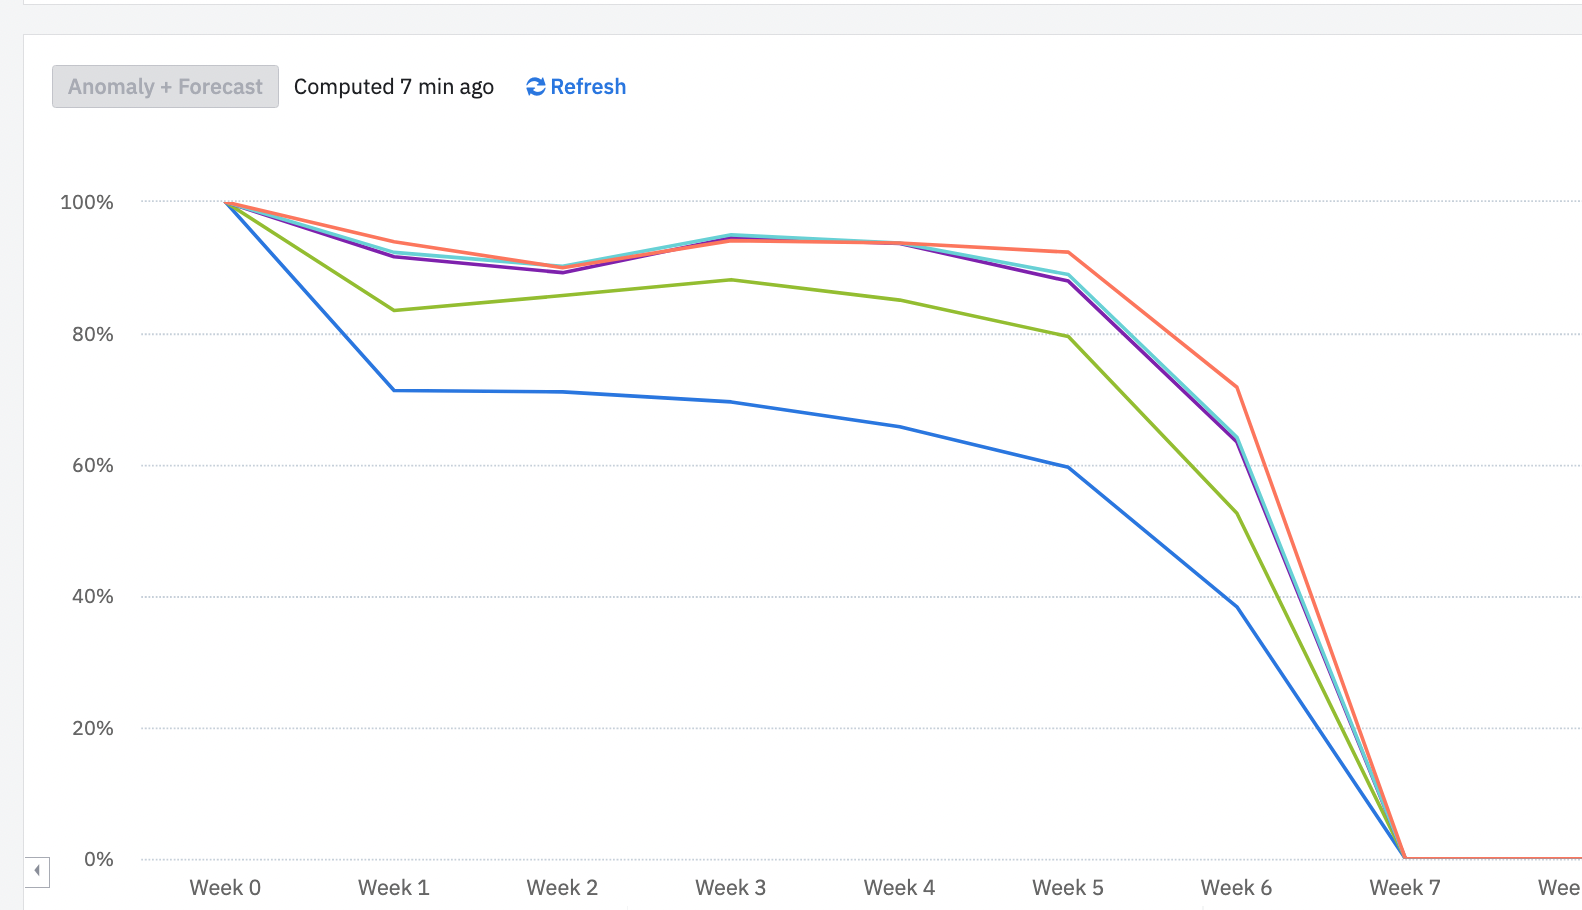
When looking at unbounded retention on a weekly scale, the numbers actually go UP over time. I’m struggling to come up with why this would be the case - maybe something just isn’t clicking in my brain.
Can anyone help explain why the retention bumps up?
If your chart’s date range is very recent, then the most common reason why the retention is going up is due to uneven sample sizes for each "day/week/month" of retention.
This is also one of the most common and frequently asked questions in the community. So I’ll link below some of the previous posts which have addressed this issue and other retention related threads -
If you don't have an Amplitude account, you can create an Amplitude Starter account for free and enjoy direct access to the Community via SSO. Create an Amplitude account. You can also create a Guest account below!
If you're a current customer, select the domain you use to sign in with Amplitude.
If you don't have an Amplitude account, you can create an Amplitude Starter account for free and enjoy direct access to the Community via SSO. Create an Amplitude account. Want to sign up as a guest? Create a Community account.
If you're a current customer, select the domain you use to sign in with Amplitude.
We use 3 different kinds of cookies. You can choose which cookies you want to accept. We need basic cookies to make this site work, therefore these are the minimum you can select. Learn more about our cookies.