There are a couple of ways to get the results you are looking for that could save you cost as the Dashboard Rest API has restrictive limits:
Use the Results from an Existing Chart endpoint. Since the chart is already created in the Amplitude UI you can pull the information programmatically using this endpoint. As mentioned, the main reason I present this option is that it will save you cost on the Dashboard Rest API limits.
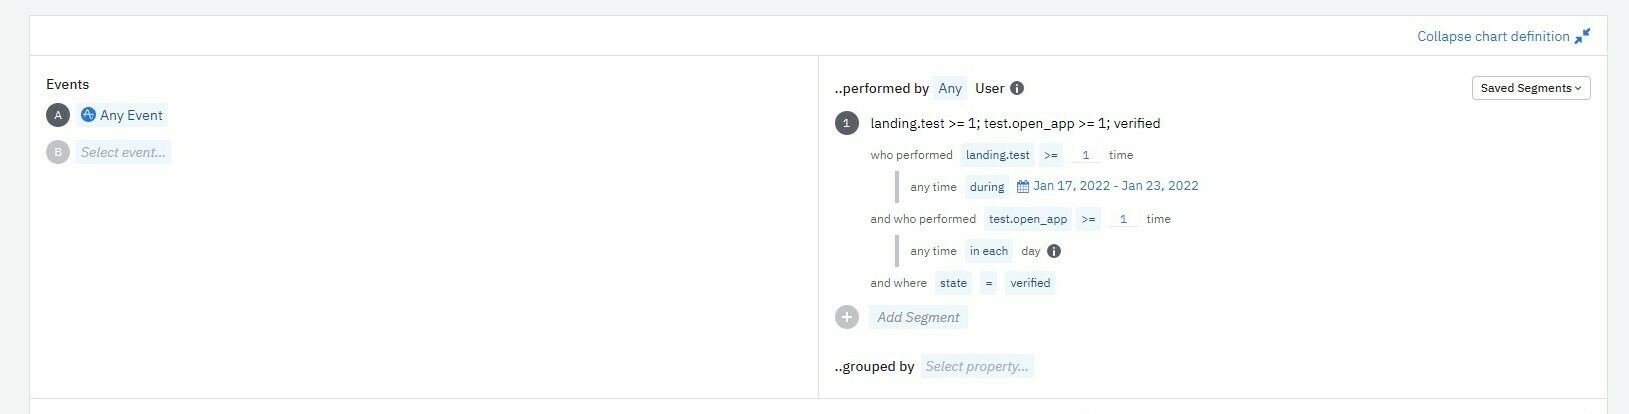
You can definitely try building out the chart as an API call and it will have a higher cost than the above option. I will be using this Demo chart that is setup similar to the screenshot you provided: https://analytics.amplitude.com/demo/chart/new/xj3emx2
The Segment definition would be as follows:
Purchase Song or Video: {op: ">=", type: "event", event_type: "Purchase Song or Video", filters: [], value: 0, time_type: "forEachInterval, “time_value”: 30}
The reason for the 30 is because the chart is looking at the last 30 days.
Play song or video: {op: ">=", type: "event", event_type: "Play Song or Video", filters: [], value: 1, time_type: "absolute", time_value: [1642377600, 1642982399]}
The time_value is the time in epoch “in between Jan 17 - Jan 23, 2022.
There are a couple of ways to get the results you are looking for that could save you cost as the Dashboard Rest API has restrictive limits:
Use the Results from an Existing Chart endpoint. Since the chart is already created in the Amplitude UI you can pull the information programmatically using this endpoint. As mentioned, the main reason I present this option is that it will save you cost on the Dashboard Rest API limits.
You can definitely try building out the chart as an API call and it will have a higher cost than the above option. I will be using this Demo chart that is setup similar to the screenshot you provided: https://analytics.amplitude.com/demo/chart/new/xj3emx2
The Segment definition would be as follows:
Purchase Song or Video: {op: ">=", type: "event", event_type: "Purchase Song or Video", filters: [], value: 0, time_type: "forEachInterval, “time_value”: 30}
The reason for the 30 is because the chart is looking at the last 30 days.
Play song or video: {op: ">=", type: "event", event_type: "Play Song or Video", filters: [], value: 1, time_type: "absolute", time_value: [1642377600, 1642982399]}
The time_value is the time in epoch “in between Jan 17 - Jan 23, 2022.
If you don't have an Amplitude account, you can create an Amplitude Starter account for free and enjoy direct access to the Community via SSO. Create an Amplitude account. You can also create a Guest account below!
If you're a current customer, select the domain you use to sign in with Amplitude.
If you don't have an Amplitude account, you can create an Amplitude Starter account for free and enjoy direct access to the Community via SSO. Create an Amplitude account. Want to sign up as a guest? Create a Community account.
If you're a current customer, select the domain you use to sign in with Amplitude.
We use 3 different kinds of cookies. You can choose which cookies you want to accept. We need basic cookies to make this site work, therefore these are the minimum you can select. Learn more about our cookies.