Solved

[Dashboard REST API] Filtering events by users who performed another event

  • 21 July 2021
  • 6 replies
  • 698 views

Badge

Hi everyone!

I’m trying to replicate a chart query via the Dashboard REST API, though I’m having trouble adding a “who performed” filter to the query.

The chart query I’m trying to match is as follows:

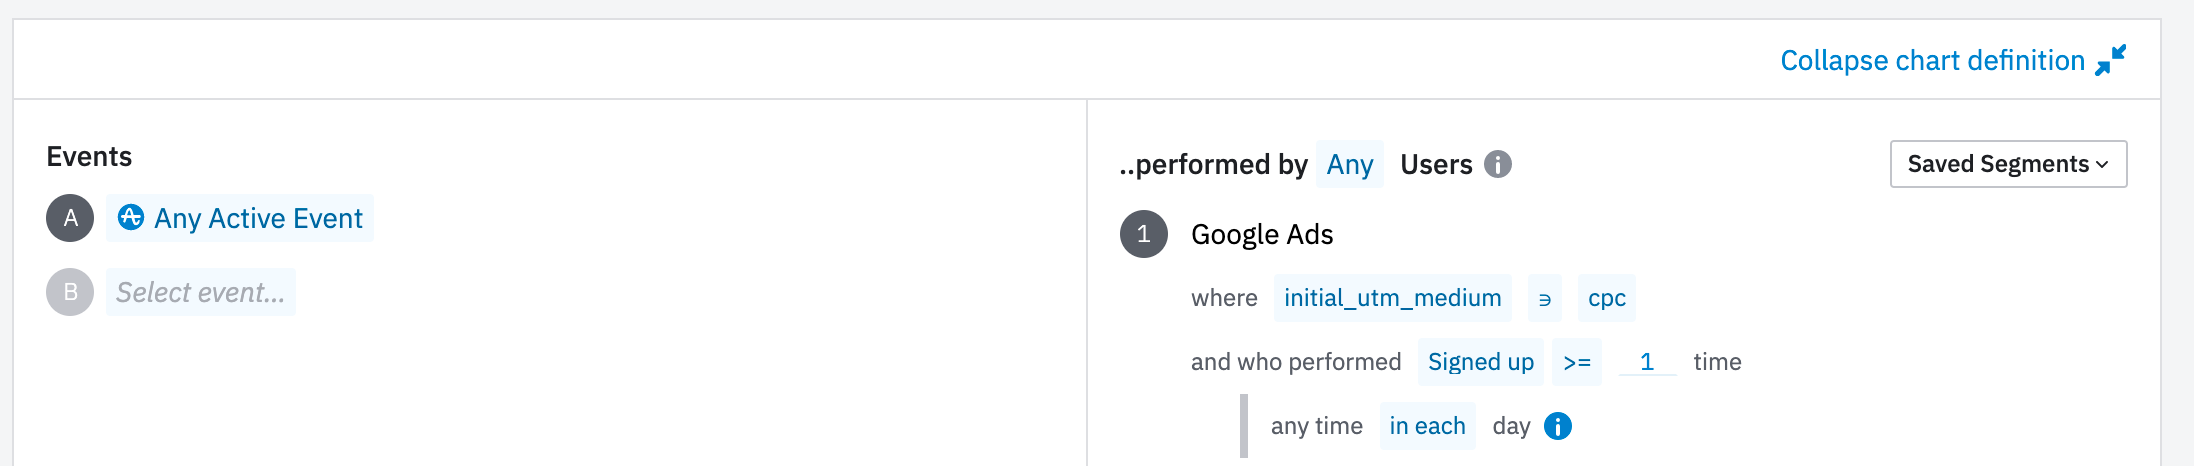
The part I’m having trouble with is the “and who performed “Signed up >= 1 time any time in each day”.


This is a simplified version of where I’ve got to, but looking through the documentation I haven’t seen any way to specify a filter for the event count performed by each specific user on each day.

The documentation seems to suggest that any chart produced by the dashboard is possible to query via the API as well, so I assume it’s possible somehow?


eventData = {
"event_type": "_active",
"filters":[
{
"subprop_type": "user",
"subprop_key": "gp:initial_utm_source",
"subprop_op": "is",
"subprop_value":["cpc"]
},{
"subprop_type": "user",
"subprop_key": "???",
"subprop_op": "greater or equal",
"subprop_value":[1]
}
]
};

const url = `https://amplitude.com/api/2/events/segmentation?e=${eventData}&m=uniques&start=20210201&end=20210710`;


Thanks for any help

icon

Best answer by Denis Holmes 27 July 2021, 11:51

View original

6 replies

Userlevel 7
Badge +10

Hey @glenn.allen ,

You are correct here. From what I see, the API documentation (under “Segment Definition”) doesn’t explicitly mention anything to include the filter for the event count performed as you pointed out.

I’m not quite sure if this functionality is missing with the current API or it’s just hidden in plain sight in there. We might need some inputs from a Platform Specialist to confirm this.

A workaround which I can think of is to create a behavioral cohort with your desired definition ( if you are on a paid plan ) and then segment by this cohort using the cohort ID value as the doc mentions.

Hope this helps!

Badge

Thanks for your response Saish!

Unfortunately we’re not on the paid plan yet (we’re a small start up, but getting great use out of Amplitude so we probably will be soon) but I’ll let the founders know that that might be a solution :)

Userlevel 6
Badge +8

Hi @glenn.allen 


Thanks for writing into Community and thanks @Saish Redkar for your input, invaluable as always!

While I am not entirely sure of the reason for this not being mentioned in the documentation, I am going to ask our Engineers in charge of the API and ask them for how to do this API call filter and I will also ask them to update the documentation accordingly. I hope to get back to you within the next 24 hours.


Kind Regards,
Denis

Badge

Fantastic, thanks very much Denis!

Userlevel 6
Badge +8

Fantastic, thanks very much Denis!

Hi @glenn.allen , can you private message me the chart you are trying to work with? I have asked the Engineers and they want to look at the chart in question. Thank you!

Userlevel 6
Badge +8

Hi @glenn.allen !

The Engineers have come back to me with an example chart which is available here.

The request payload for that chart is

{"editId":null,"definition":{"type":"eventsSegmentation","params":{"segments":[{"conditions":[{"group_type":"User","prop":"gp:UTM_Campaign","prop_type":"user","op":"contains","type":"property","values":["(none)"]},{"op":">=","type":"event","event_type":"Purchase Song or Video","filters":[],"value":0,"time_type":"forEachInterval","time_value":30}]}],"interval":1,"nthTimeLookbackWindow":365,"globalDefinitionApplied":false,"metric":"uniques","countGroup":"User","groupBy":[],"events":[{"event_type":"_active","filters":[],"group_by":[]}],"range":"Last 30 Days"},"app":"168342","version":33},"context":{"location":"TAB","cohorts":{}},"isUsageReport":false,"feature_tags":[],"client_query_id":"jNh9UVPlkwnwlm","freshness":"LATEST"}

with that segment filter in particular being

{"op":">=","type":"event","event_type":"Purchase Song or Video","filters":[],"value":0,"time_type":"forEachInterval","time_value":30}

They should send that as a segment definition.


I hope this is enough now that you have an example to build out your chart!

Reply