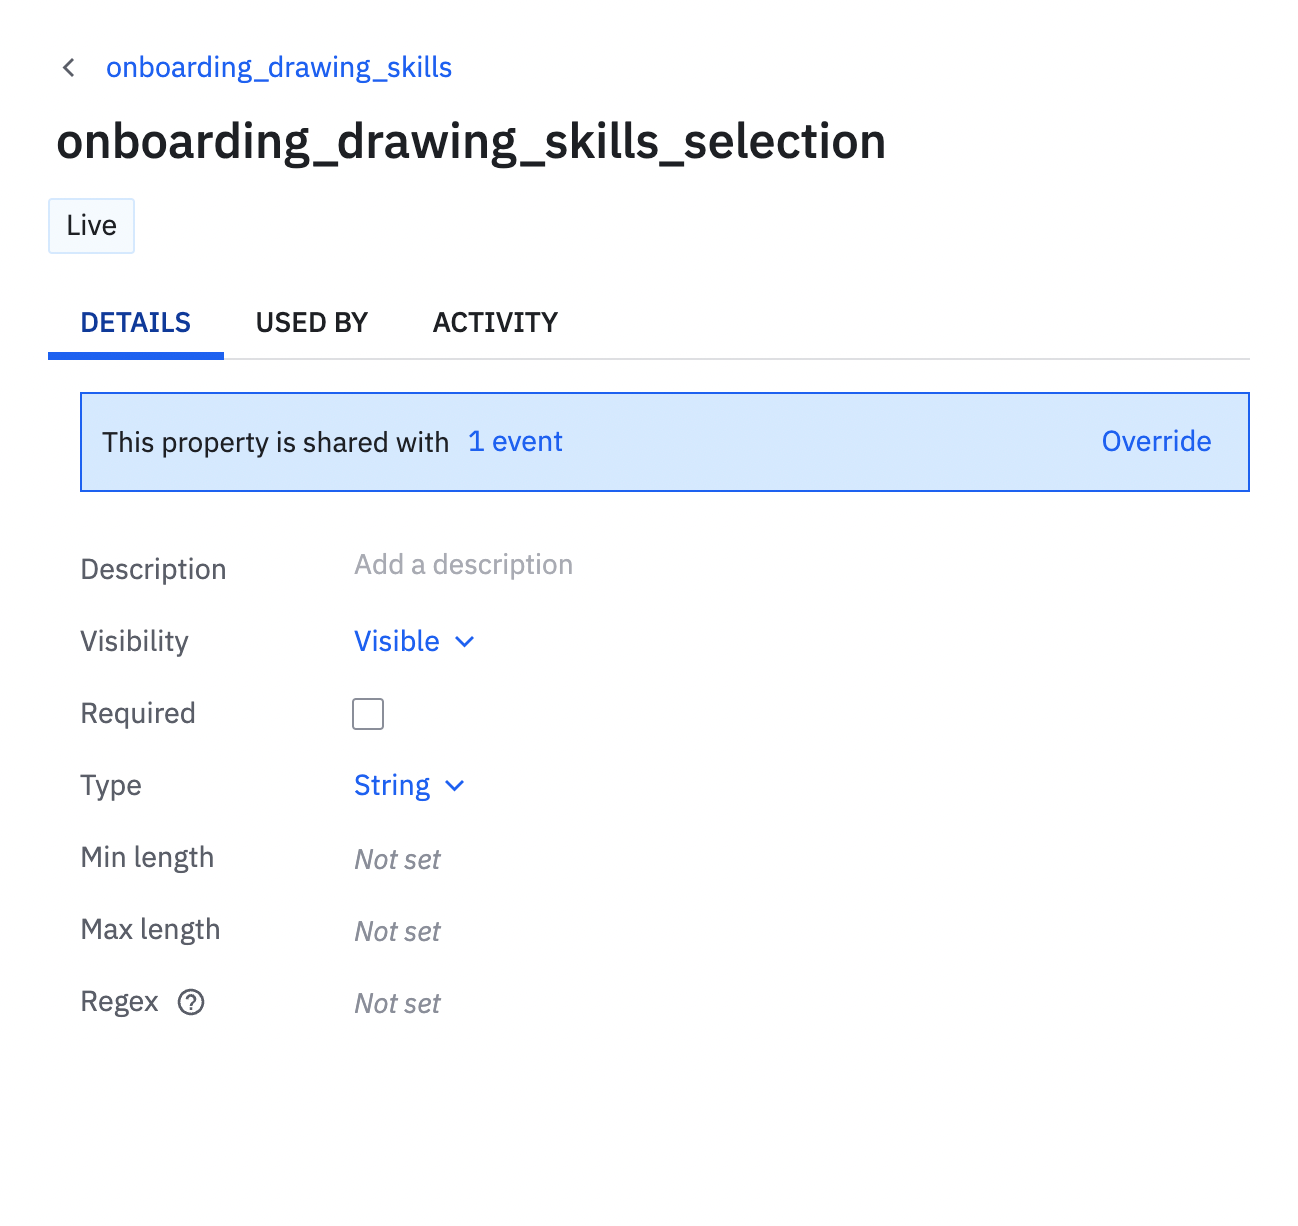
Data UI won’t actually show you the values that the property is capturing, if that’s your goal.
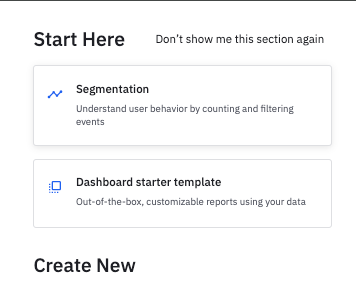
If your data ingestion is live, you should be able to create a basic event segmentation chart using the desired event and use group by on this event property see the captured values.
Let me know if this was what you were looking for.
Data UI won’t actually show you the values that the property is capturing, if that’s your goal.
If your data ingestion is live, you should be able to create a basic event segmentation chart using the desired event and use group by on this event property see the captured values.
Let me know if this was what you were looking for.
If you don't have an Amplitude account, you can create an Amplitude Starter account for free and enjoy direct access to the Community via SSO. Create an Amplitude account. You can also create a Guest account below!
If you're a current customer, select the domain you use to sign in with Amplitude.
If you don't have an Amplitude account, you can create an Amplitude Starter account for free and enjoy direct access to the Community via SSO. Create an Amplitude account. Want to sign up as a guest? Create a Community account.
If you're a current customer, select the domain you use to sign in with Amplitude.
We use 3 different kinds of cookies. You can choose which cookies you want to accept. We need basic cookies to make this site work, therefore these are the minimum you can select. Learn more about our cookies.