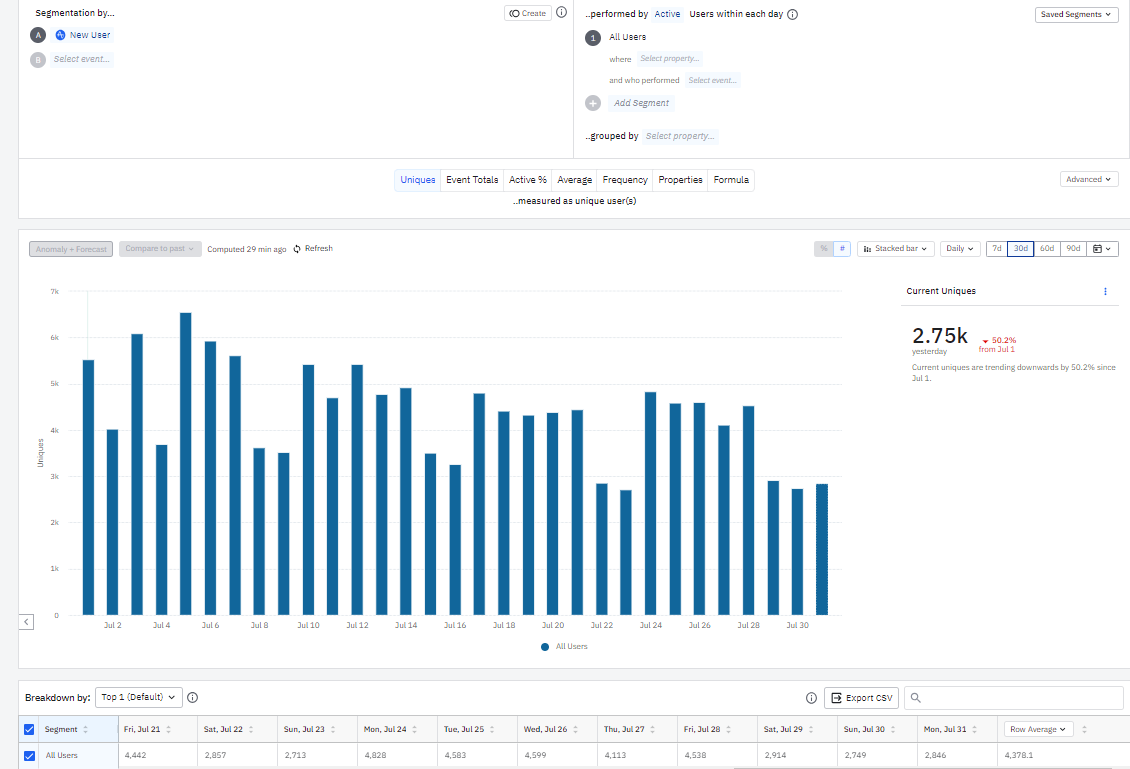
How would I distinguish time periods by color in a chart? Since it's 1 segment on a daily chart for 30 days, I'd like to highlight each day of week (Mon-Sun) a different color, with up to 7 total. I don't seem to see that ability within the charts.
Initial community searches for “color” don’t seem to pull up a relevant page.
Also, this is my 1st post, Amplitude data only went live for our web analytics June 28!
