New

🟢 DELIVERED - using colors so the viewer understands the data better?

Related products:Product Analytics
  • July 31, 2023
  • 1 reply
  • 12 views
  • Herb Lau

Dan (Thanks, Dan!) helped me understand that colors as a distinguishing factor for visuals isn’t a strong ability right now.


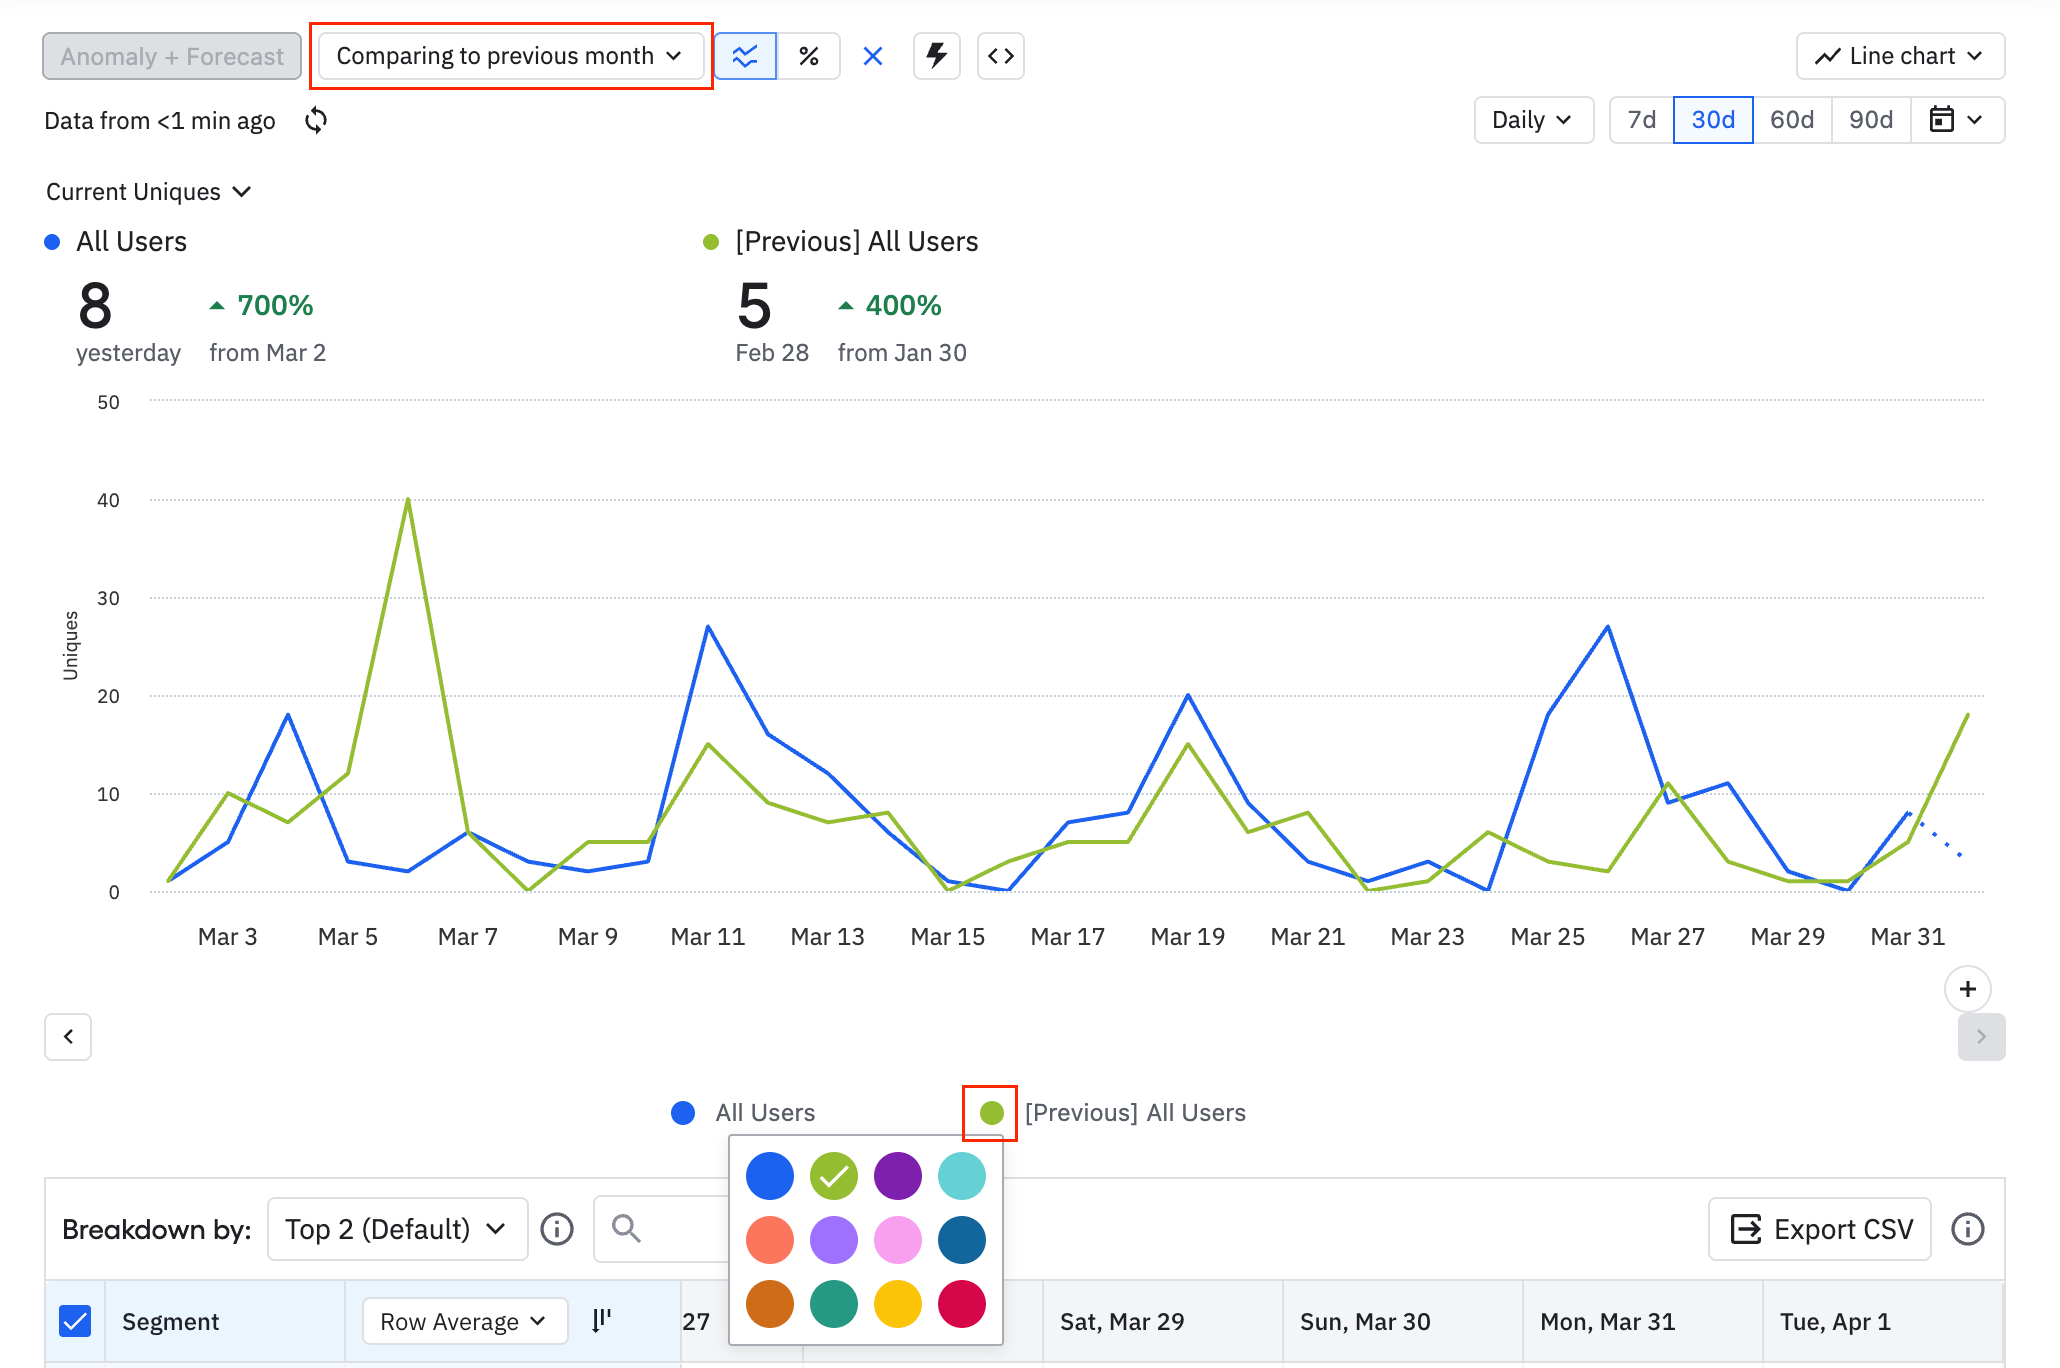
Adding the ability to make different time periods different colors may be quite visually helpful for us as we show the analytics to others for them to understand information quicker and in turn get insights quicker and easier.


Thanks!


Pinned reply

April 1, 2025

Hey ​@Herb Lau, closing the loop on this thread! Our UI has changed significantly since you posted and it’s now possible to change the colors associated with comparing your data to different time periods. If you use the “compare to past” functionality, you can select a different color for both the previous data or the current data by clicking the dot beside the label name.


This topic has been closed for comments

1 reply

Beth Saunders
Community Manager
Forum|alt.badge.img+2
  • Community Manager
  • 54 replies
  • April 1, 2025

Hey ​@Herb Lau, closing the loop on this thread! Our UI has changed significantly since you posted and it’s now possible to change the colors associated with comparing your data to different time periods. If you use the “compare to past” functionality, you can select a different color for both the previous data or the current data by clicking the dot beside the label name.


Cookie policy

We use cookies to enhance and personalize your experience. If you accept you agree to our full cookie policy. Learn more about our cookies.

 
Cookie settings