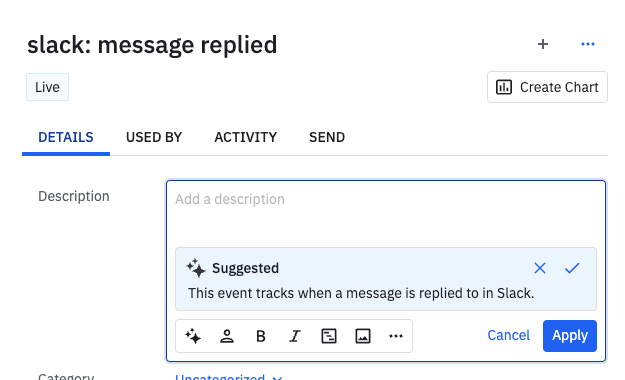
The problem: Writing descriptions is helpful for chart consumers, but time-consuming for chart creators - especially when the chart has nuance around segments, groups, per day, per week, etc.
Leverage AI to create descriptions for charts - saves time on creating descriptions, provides guidance for chart nuance & interpretation. Can easily be edited by users to adjust their description to their liking. Their edits can also be used to train ai event descriptions and improve chart descriptions as it goes.
New
DELIVERED - AI Generated Chart Descriptions
Pinned reply
Reply
Welcome to the Amplitude Community!
If you don't have an Amplitude account, you can create an Amplitude Starter account for free and enjoy direct access to the Community via SSO. Create an Amplitude account. You can also create a Guest account below!
If you're a current customer, select the domain you use to sign in with Amplitude.
analytics.amplitude.com analytics.eu.amplitude.comor
Welcome to the Amplitude Community!
If you don't have an Amplitude account, you can create an Amplitude Starter account for free and enjoy direct access to the Community via SSO. Create an Amplitude account. Want to sign up as a guest? Create a Community account.
If you're a current customer, select the domain you use to sign in with Amplitude.
analytics.amplitude.com analytics.eu.amplitude.comor
Enter your E-mail address. We'll send you an e-mail with instructions to reset your password.


