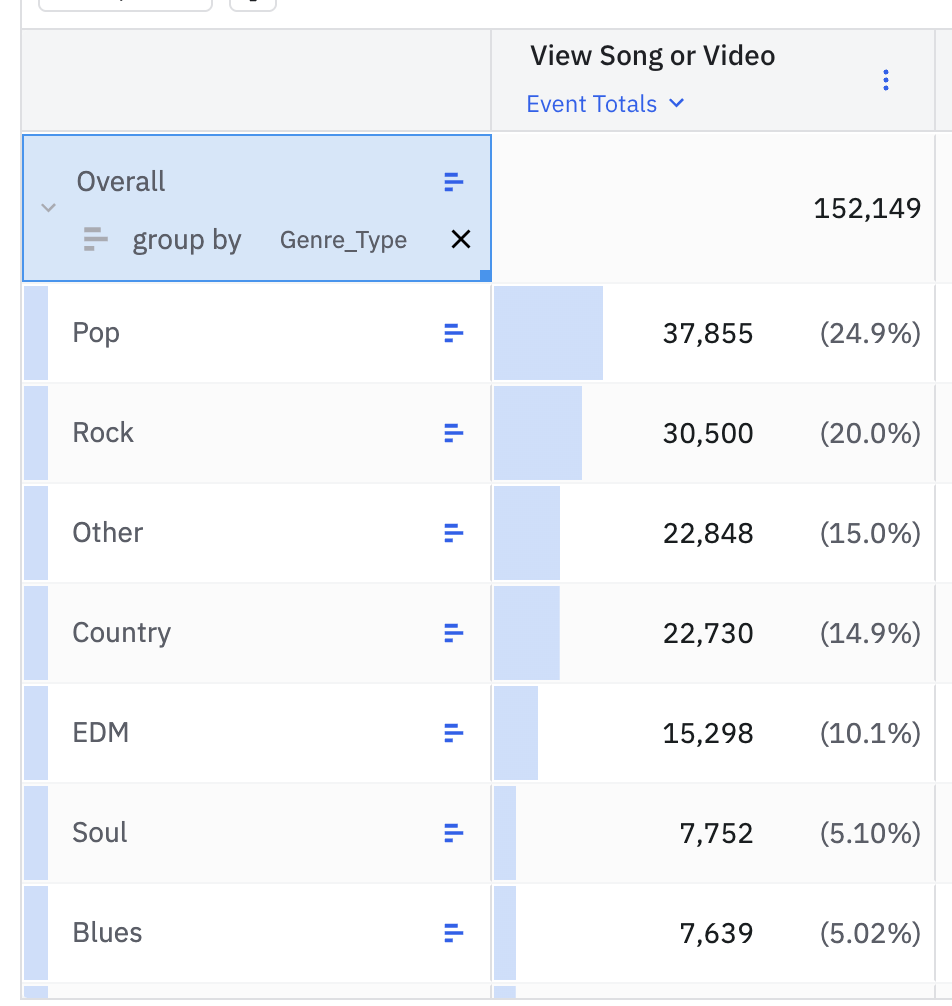
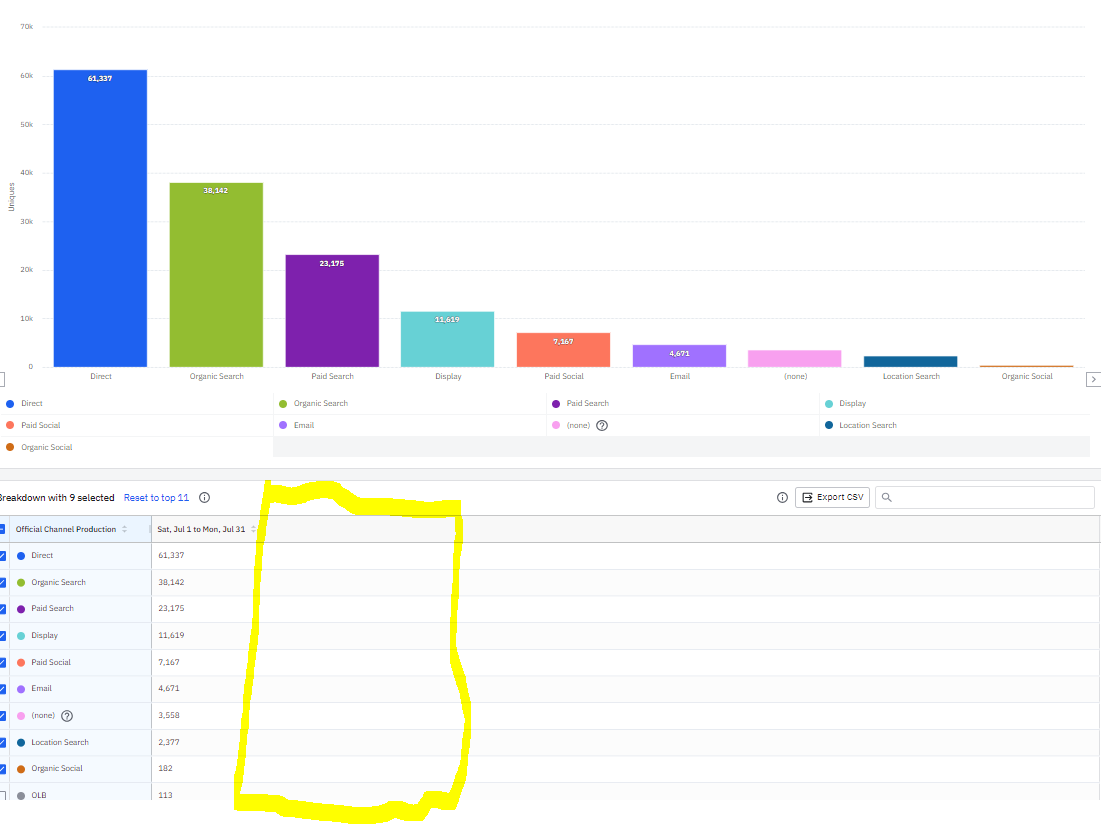
Unless I missed something (which is always possible!) There’s no way add some sort of calculated field to the table as pictured above. In this case, it would be helpful to add a calculated field which shows the percentage of the total the individual row is, for educating the viewers I would be attempting to show this chart and table to. The data tables as an element from the drop-down menu choice offer the percentages built in, but the data tables below charts don’t seem to have that built in/allow for the addition of a field to do so. Thanks!