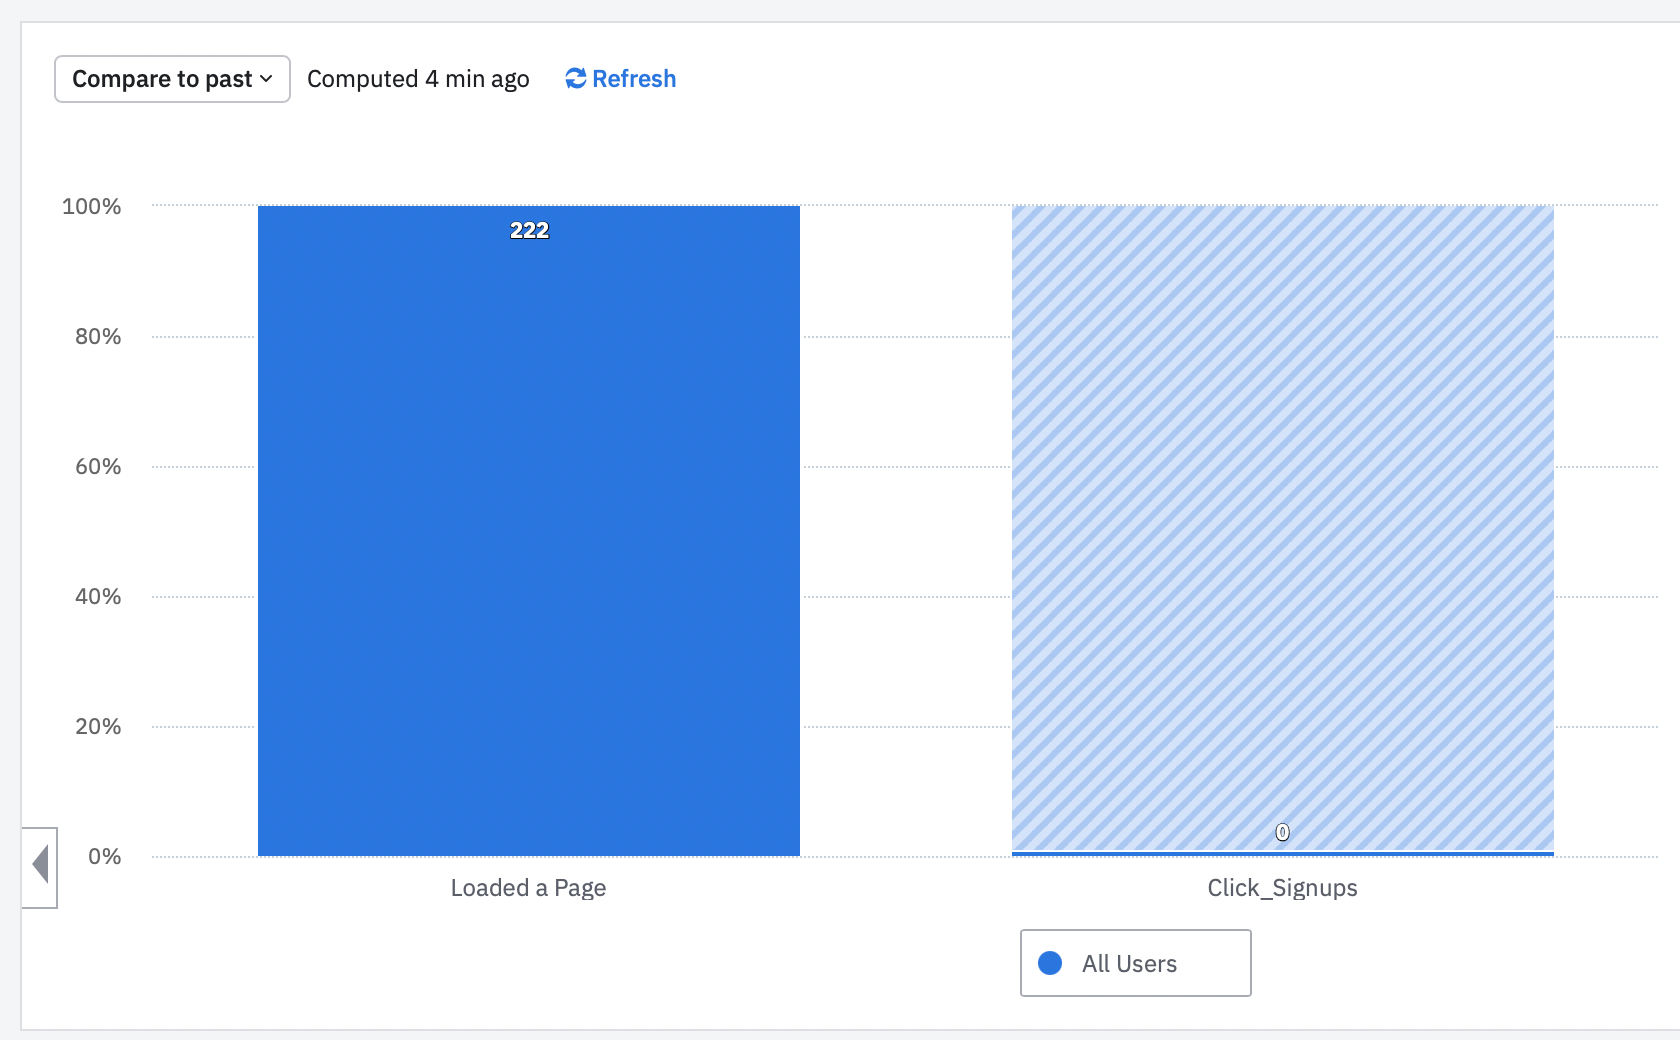
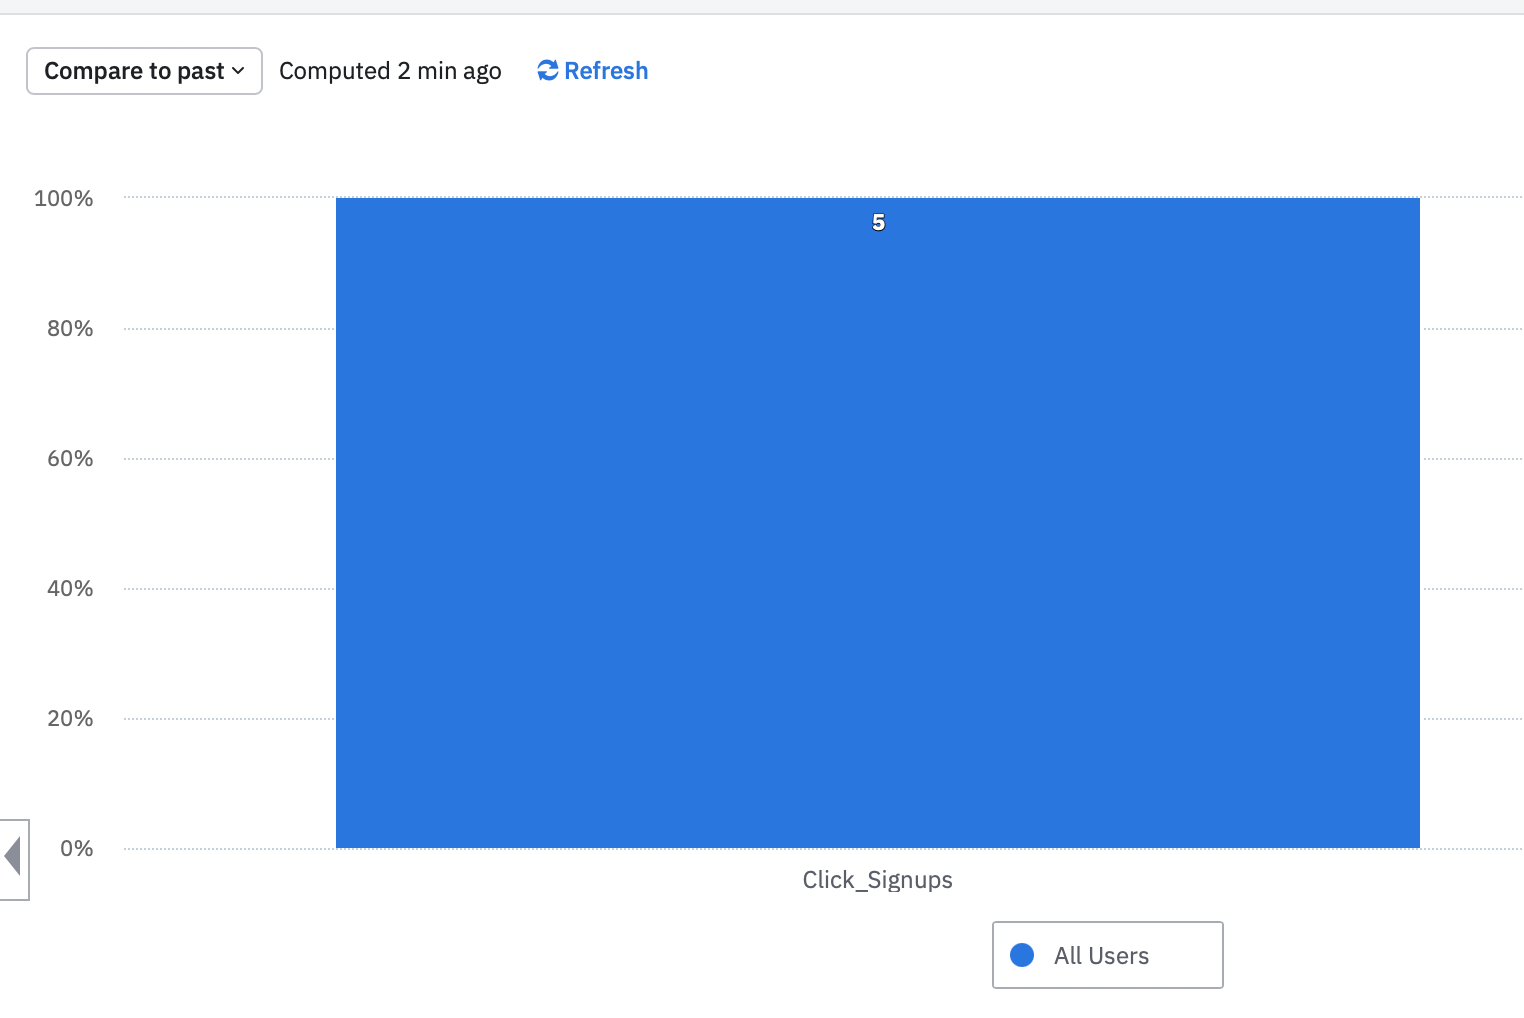
Hey @Steven
A couple of things to check in this case -
- Are you keeping the time duration same when removing the Loaded Page event in the funnel?
- Can you make sure that the funnel order is correct as per your use case? i.e if you have put it as exact order and users are actually performing any other event between Loaded Page and Click_Signups
- If the funnel completion time period is large enough for your use case to include the completion of Click_Signup event
Hope this helps.
I don’t understand what you mean here. It doesn’t look like a complete sentence.
“If the funnel completion time period is large enough for your use case to include the completion of Click_Signup event”
Can you elaborate?
It’s difficult to comment on this, as there is very little information to go with. Couple suggestions:
- Include a screenshot of how you have set up the query, including the options below the data and user selection fields.
- Check Pathfinder tool. Choose your Click_signups event and Ending with option to see which events lead to your Click_signups event. Is the “Loaded a Page” event triggered correctly before it?
Hey @Steven ,
What I meant by that was if your funnel completion time period is pretty small and the actual Click SignUp event is happening beyond that, then you might run into potential issues.
You can also check the Pathfinder tool as Mikko suggested. Also, including your funnel query setup screenshot will help understand this case better.
Hi @Steven - along with @Saish Redkar & @MikkoKarvonen’s suggestions, I’d like to provide an example from our demo environment, which may shed light on what you are seeing in your organization. Based on what I know about your funnel (step 1 = Loaded a Page & step 2 = Click_Signups and you are seeing Click_Signups increase from 0 to 5 when removing step 1 (Loaded a Page)), I’ve created this sample chart (step 1 = Play Song or Video, step 2 = Purchase Song or Video), and we can see that Purchase Song or Video has a value of 230,068 unique users. When I remove step 1 in this chart, we can see that the value for Purchase Song or Video has increased to 236,930 unique users. This increase is similar to yours since step 2 is no longer conditional to step 1. Does this help?


