Solved

A Specific Profile ID is not pulled in via Dashboard API


Userlevel 1
Badge

Dear Amplitude Support,


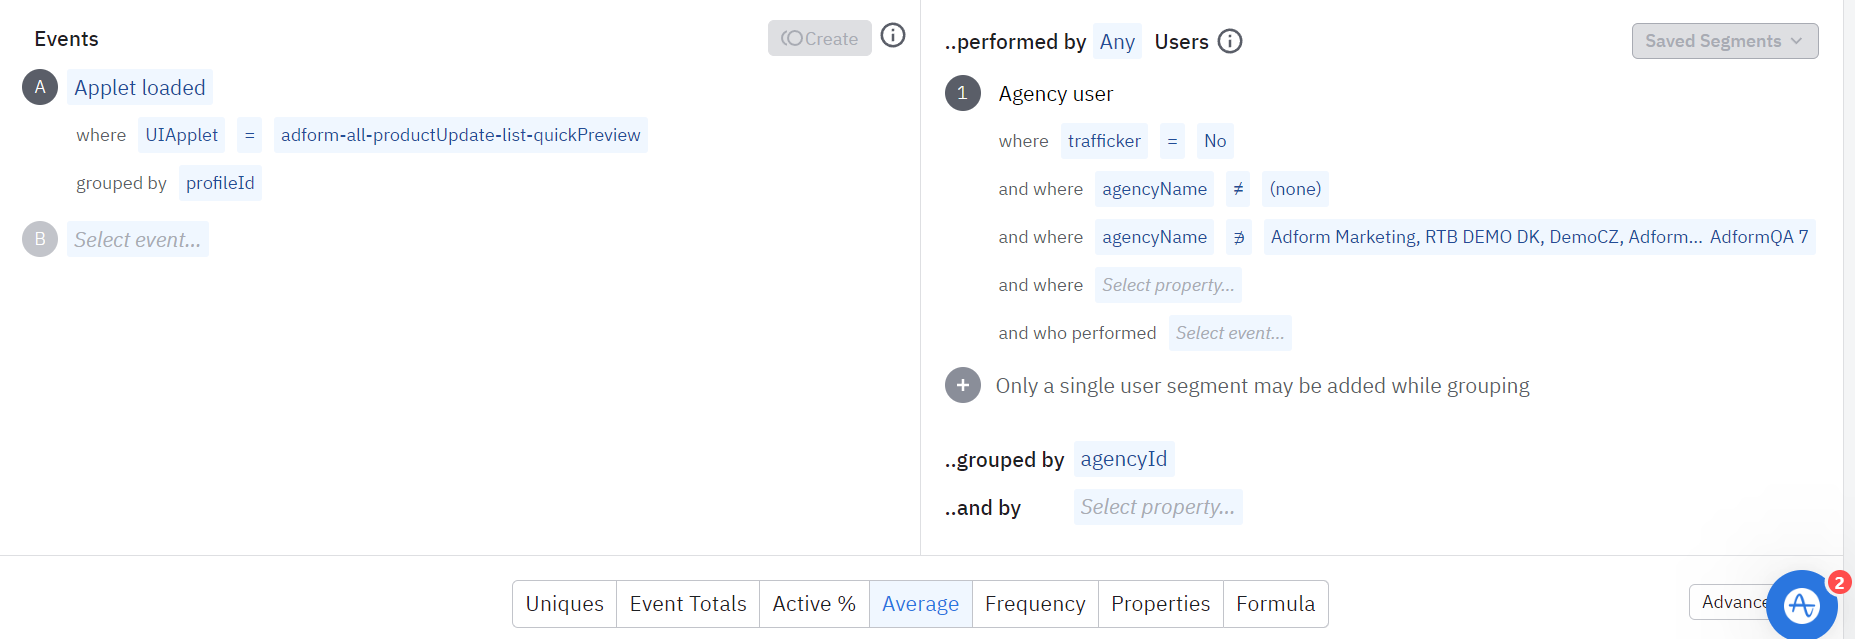
Currently I am trying to pull a specific dashboard from below,

https://analytics.amplitude.com/adform/chart/i8u86h8

Using the Python code as below,

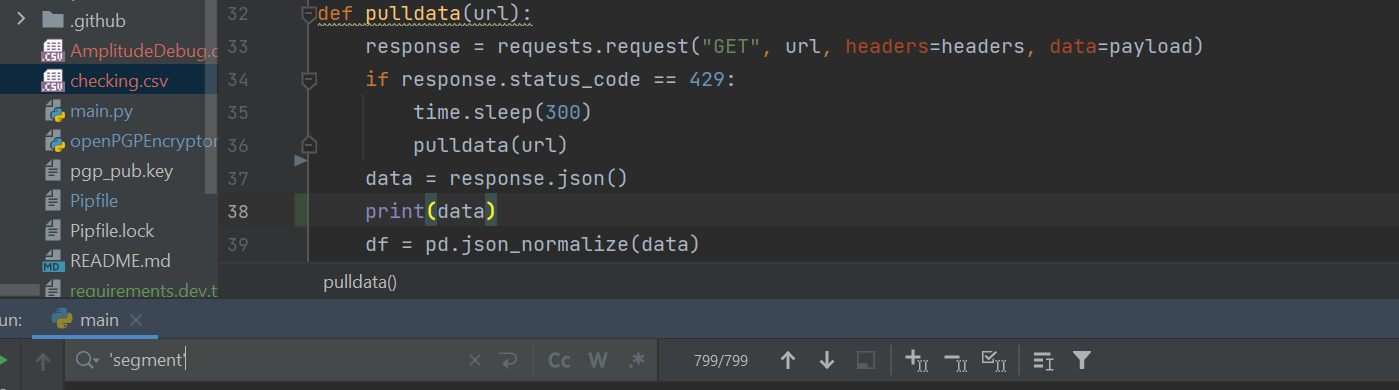
payload = {}headers = {"Authorization": os.environ.get("AUTHORIZATION_KEY")}
def pulldata(url):    response = requests.request("GET", url, headers=headers, data=payload)    if response.status_code == 429:        time.sleep(300)        pulldata(url)    data = response.json()    df = pd.json_normalize(data)    df = df[["data.series", "data.seriesLabels", "data.xValues"]]    return df

I called the pulldata function as below, which returns huge amount of data

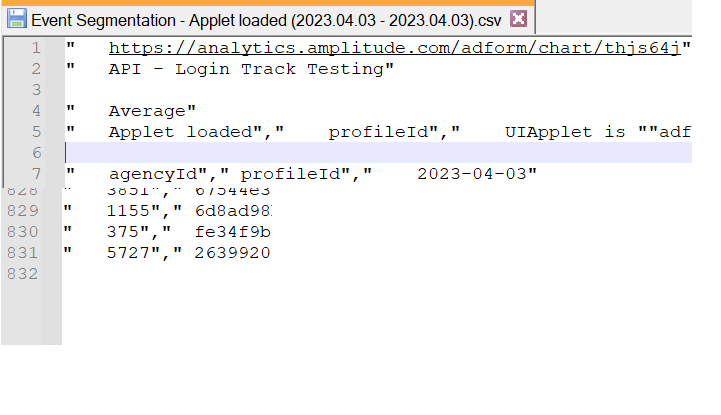
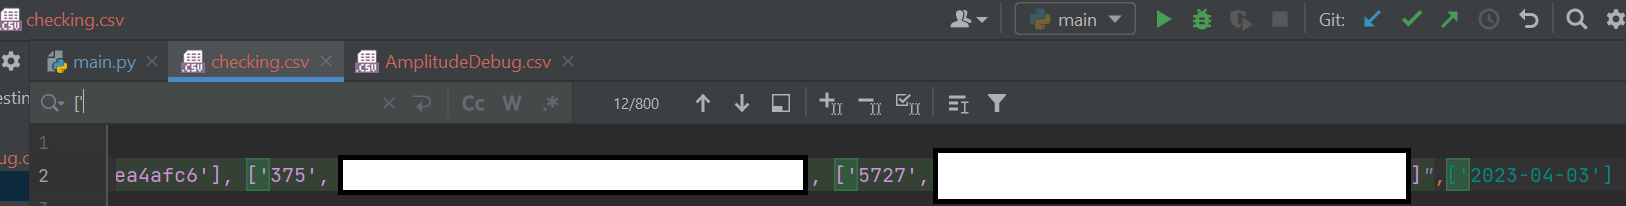
logintrack = pulldata("https://amplitude.com/api/3/chart/i8u86h8/query")logintrack["Type"] = "Active User"logintrack["UI"] = "Regular UI"logintrack.to_csv("Checking.csv")


In the original dashboard there’s a profile id with specific value eg. “XYZ”  with multiple data throughout the year. However, that specific profile id “XYZ” does ot show up when I try to pull it via Dashboard API.

Do you know what might be the problem?


Thank you!

icon

Best answer by jmagg 29 March 2023, 23:32

View original

17 replies

Userlevel 7
Badge +10

Hi @Audino.Anter 

Does this chart use a group by clause?

I’m not 100% sure, but it looks like the existing chart API response might be running into result pruning.


I don’t see any mention of pruning in the API results, but I know that segmentation chart does undergo pruning when a group by is used. It should have been the other way round i.e. API response should list out all the ids if you are grouping by user id.


Userlevel 1
Badge

Hi @Saish Redkar ,

I just noticed that the chart has a warning “The results of this query are pruned”.

Yes, the chart use a group by clause as below,

Is there any alternative to build a similar dashboard that contains all the data above, where everything can be pulled via API?

Thanks!

Userlevel 7
Badge +10

I think the Rest API should give all the results even with a double group by.

For double group-bys, results may be limited to 500 group by results, in which each group by value pair is counted as a single result in the event seg chart.

Can you do a csv export of your chart view and compare the total item rows you get vs the one displayed on the chart and the API response? That might help to some extent.

Tagging the platform specialists for added insights into this -

  @belinda.chiu  @Denis Holmes@eddie.gaona 

Userlevel 6
Badge +9

Thanks @Saish Redkar I’ll make sure this gets submitted as a ticket as well. 

Userlevel 5
Badge +6

Hi @Audino.Anter -- 

While there isn't an out-of-the-box solution in the UI for expanding the number of results that are pruned, here are some workarounds you can use to access more results from your chart:

  • Apply more filters on your chart to surface-specific pruned users. By adding filters you will narrow down the pool of users and surface more of the values you want to see
  • Change the date range to a smaller period of time (i.e. last 200 days)
  • The limit when you download the users in a CSV is 10k values. Pruned users will be included in chart CSV exports
  • Dashboard REST API maximum limit for group bys is 1000 values. You can try exporting your chart results using this API in order to access more results than what's seen in the UI


Thank you for your help here @Saish Redkar!

Userlevel 1
Badge

Hello @jmagg 

Thank you for the detailed insights!

I would like to ask, is there any other Amplitude API that would provide the entire bulk data without any limitation?

I noticed the documentation below that there are many different types of apis.

https://www.docs.developers.amplitude.com/analytics/api-reference-overview/#analytics-and-data-apis

I am just wondering which of the api above should be used that contain all the data below has the highest data rows limit?

https://analytics.amplitude.com/adform/chart/i8u86h8

https://analytics.amplitude.com/adform/chart/8hsipyp

https://analytics.amplitude.com/adform/chart/m1aw35y

I will scale down the date filter and make it 30 days instead.

Sincerely,

Audino

Userlevel 7
Badge +10

Hi @Audino.Anter 

Of all the APIs listed in there, only Dashboard REST API will be able to help you get data from your existing charts. All the other APIs are used for various other purposes.

As Julia mentioned, the CSV export of the existing chart from the UI has the highest chance of giving the maximum count.

If you want the highest coverage across a larger time interval, then you should look at exporting your event data with Export API or directly to some supported destinations (like snowflake). You can then do a distinct count on the desired property using custom SQL.

However, if you are just looking to get list of unique user ids satisfying a given condition, then creating a cohort and then exporting it is also a possible way. You have a limit of 1M users using this approach.

Userlevel 5
Badge +6

Ditto @Saish Redkar!

Userlevel 1
Badge

Hi @Saish Redkar ,

Sorry for bothering you again.

I tried to pull a small amount of data from the Amplitude Dashboard API. I pulled 1 hour worth of data from one of the dashboards above.

I noticed that the API Limit value is 1000 based on the previous response. When I exported the CSV, there were around 800 rows of data, but when I pulled via Dashboard API only ~700 worth data were exported.

Is it possible that not all data get extracted even if it’s below the 1000 rows limit?

Thank you for the support!

Userlevel 5
Badge +6

Hi @Audino.Anter -- would you mind sharing the URL to the chart you’re referencing in your most recent message please? I would be happy to take a look and see if I can determine why the CSV returns 800 rows whereas the Dashboard API returns only 700 rows.

Userlevel 1
Badge

Hi @jmagg ,


This is the dashboard
https://analytics.amplitude.com/adform/chart/thjs64j


I tried to pull the data for only 1 hour. The export CSV gave me 824 rows of data (831 - 7 rows of header). I also confirm that there’s no null value for the 3 or 4 digits agencyID on the csv file.

The Dashboard API returns 799 data. I used CTRL+F [‘ to calculate the number of 3 or 4 digit IDs minus one for the date 2023-04-03.

I pulled the raw data with the Python code below, to confirm that I did not make any change in the Amplitude Data being pulled.

def pulldata(url):    response = requests.request("GET", url, headers=headers, data=payload)    if response.status_code == 429:        time.sleep(300)        pulldata(url)    data = response.json()    df = pd.json_normalize(data)    df = df[["data.series", "data.seriesLabels", "data.xValues"]]    df.to_csv("checking.csv")
if __name__ == "__main__":    pulldata("https://amplitude.com/api/3/chart/thjs64j/query")

The ‘segment’ which refers the 3 or 4 digits AgencyID also shows 799 matches only, I print the raw data just to be sure.

I also checked this with other dates for 1 hour worth of data, and they all provide different number of rows, where the data pulled via API is smaller than the export CSV although it’s less than 1000 rows.


Thank you!

Userlevel 5
Badge +6

Hi @Audino.Anter -- thank you for the details. I was able to reproduce this on my end. Since I’m unsure why the CSV returns 824 rows and the API only 799, I’ve reached out to the Engineering team for assistance. I’ll be in touch as soon as I hear back from them!

Userlevel 5
Badge +6

Hi @Audino.Anter -- Engineering took a look and believes this may be a bug. That said, I filed a bug report so they can look further into it. I’ll keep you posted!

Userlevel 1
Badge

Hi @jmagg , thank you for your help. I will wait for an update from your side!

Userlevel 1
Badge

Hi @jmagg ,


Did the engineering team provide estimated time when the bug will be fixed?


Thank you

Userlevel 5
Badge +6

Hi @Audino.Anter - thank you for the nudge! I actually just heard back from Engineering yesterday and have some information to relay to you. Here’s a note from Engineering --

I read the code and just found the backend has another limit on the number of event properties for each segment group. It’s 10 or limit/number of segment groups, whichever is larger. So even though the overall result does not exceed the limit (which is 1000 for Dashboard REST API), the result in a single segment group can exceed the limit and get pruned. The more group segments there are (in the ticket case, it’s the number of different agencyId), the more likely the result of each group segment (agencyId) is pruned. There are over 400 different values of agencyId so the limit for each of them is 10. If there are more than 10 profileId for an agencyId, only 10 of them will be kept.

For CSV export, the overall limit is 10000, so the limit for each segment group is max{10, 10000/~400} ~= 25. That caused the result in CSV have more rows than the REST API. So this is an expected behavior.


Does this help clarify?

Userlevel 1
Badge

Hi @jmagg ,


Yes, it clarifies my doubts. Thank you!

Reply