Hey All!
I have a chart set up as the ‘user session type’ looking at avg length.
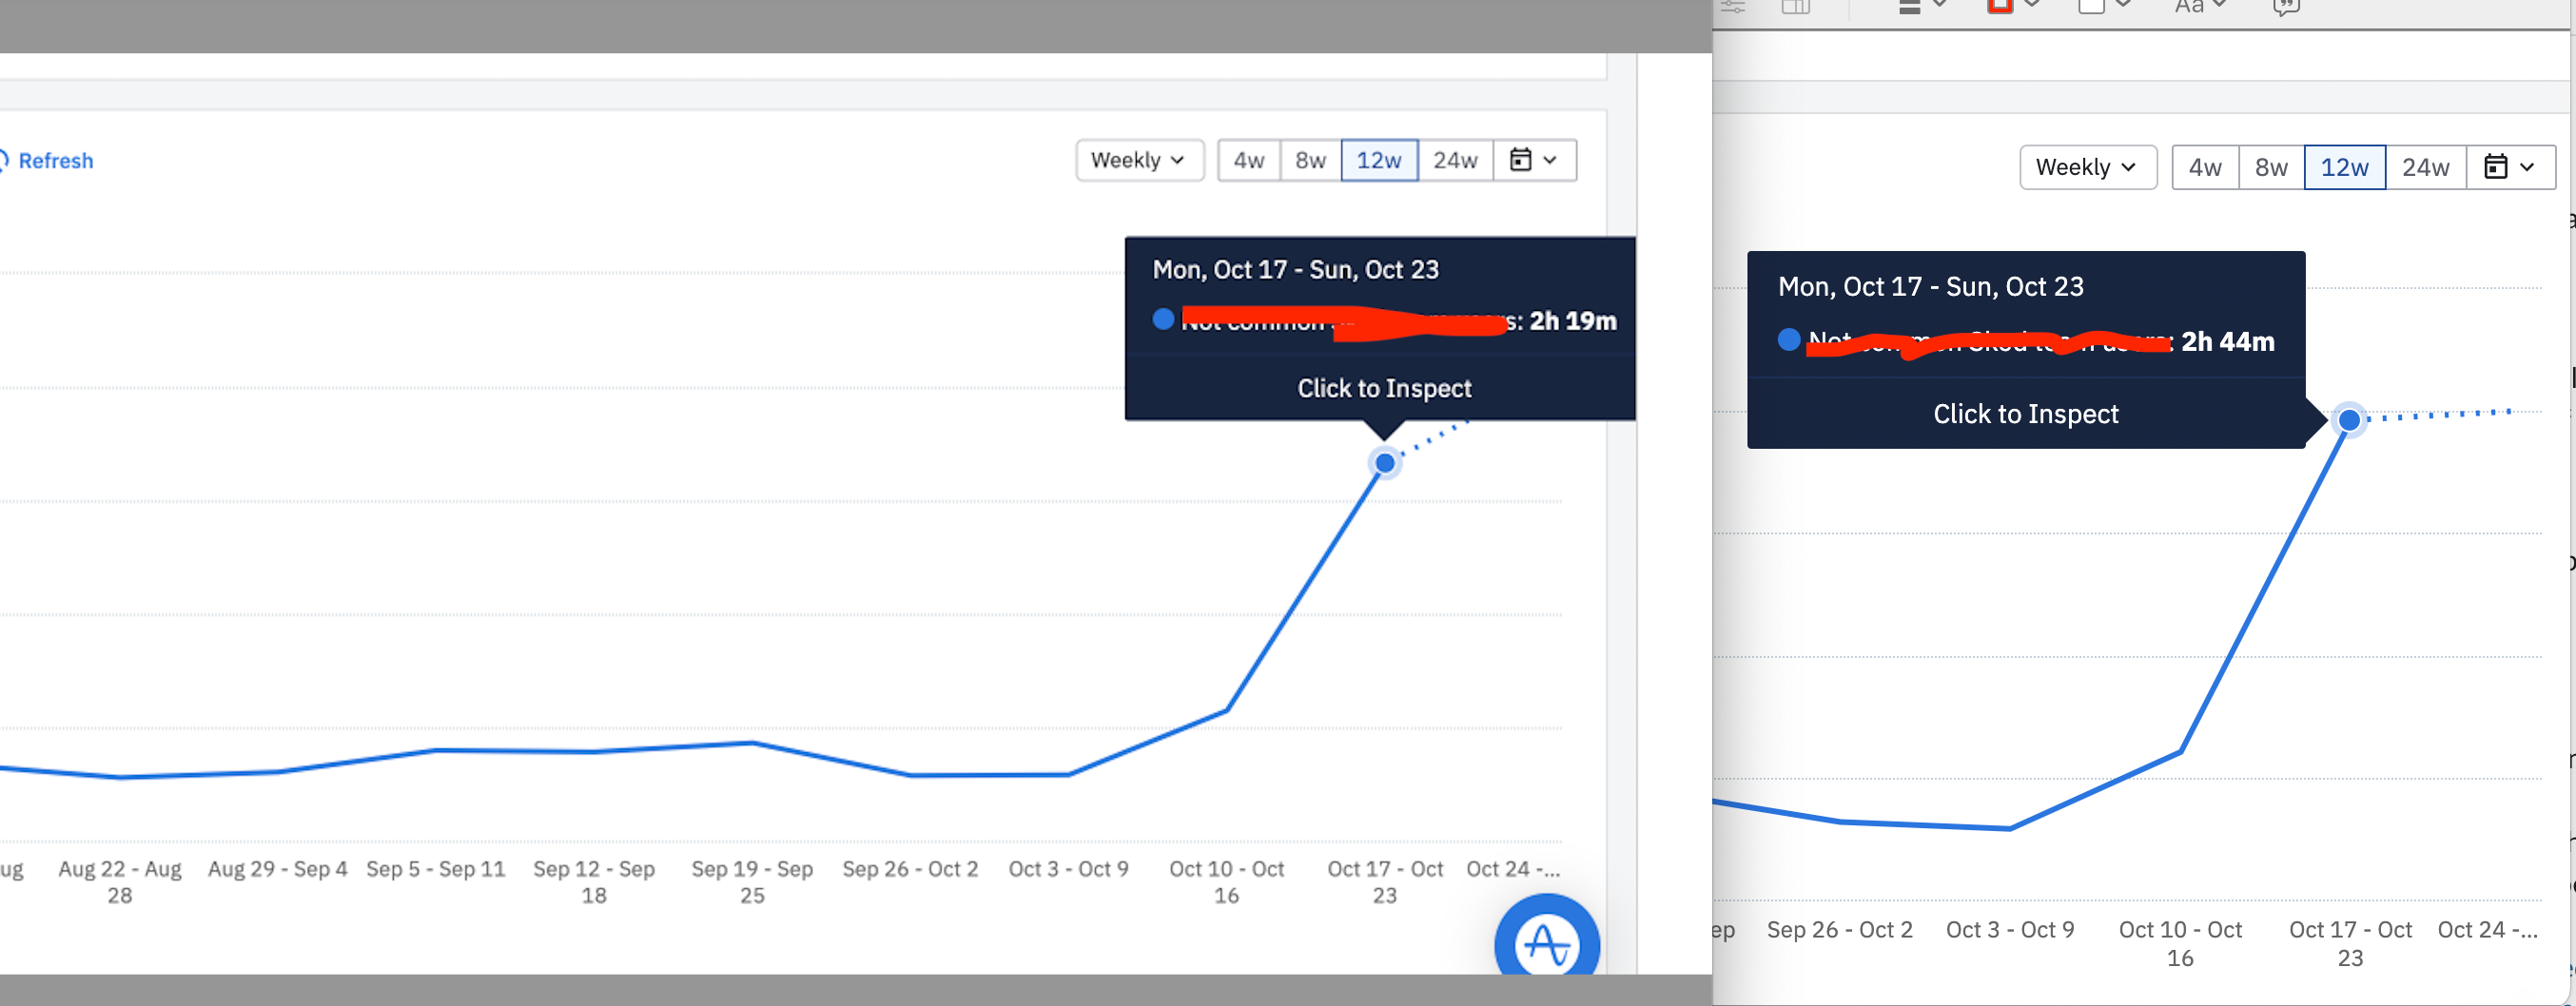
I’ve been checking this chart for a little while and some of the numbers for previous weeks seem to be changing and I’m not sure why this would be the case.
For example, two screen grabs below. One from this morning & one from this afternoon. The weeks previous to this also have changed data.
Any ideas what this could be?


