
Hi all,
Wanted to get confirmation that I’m interpreting this retention chart correctly.
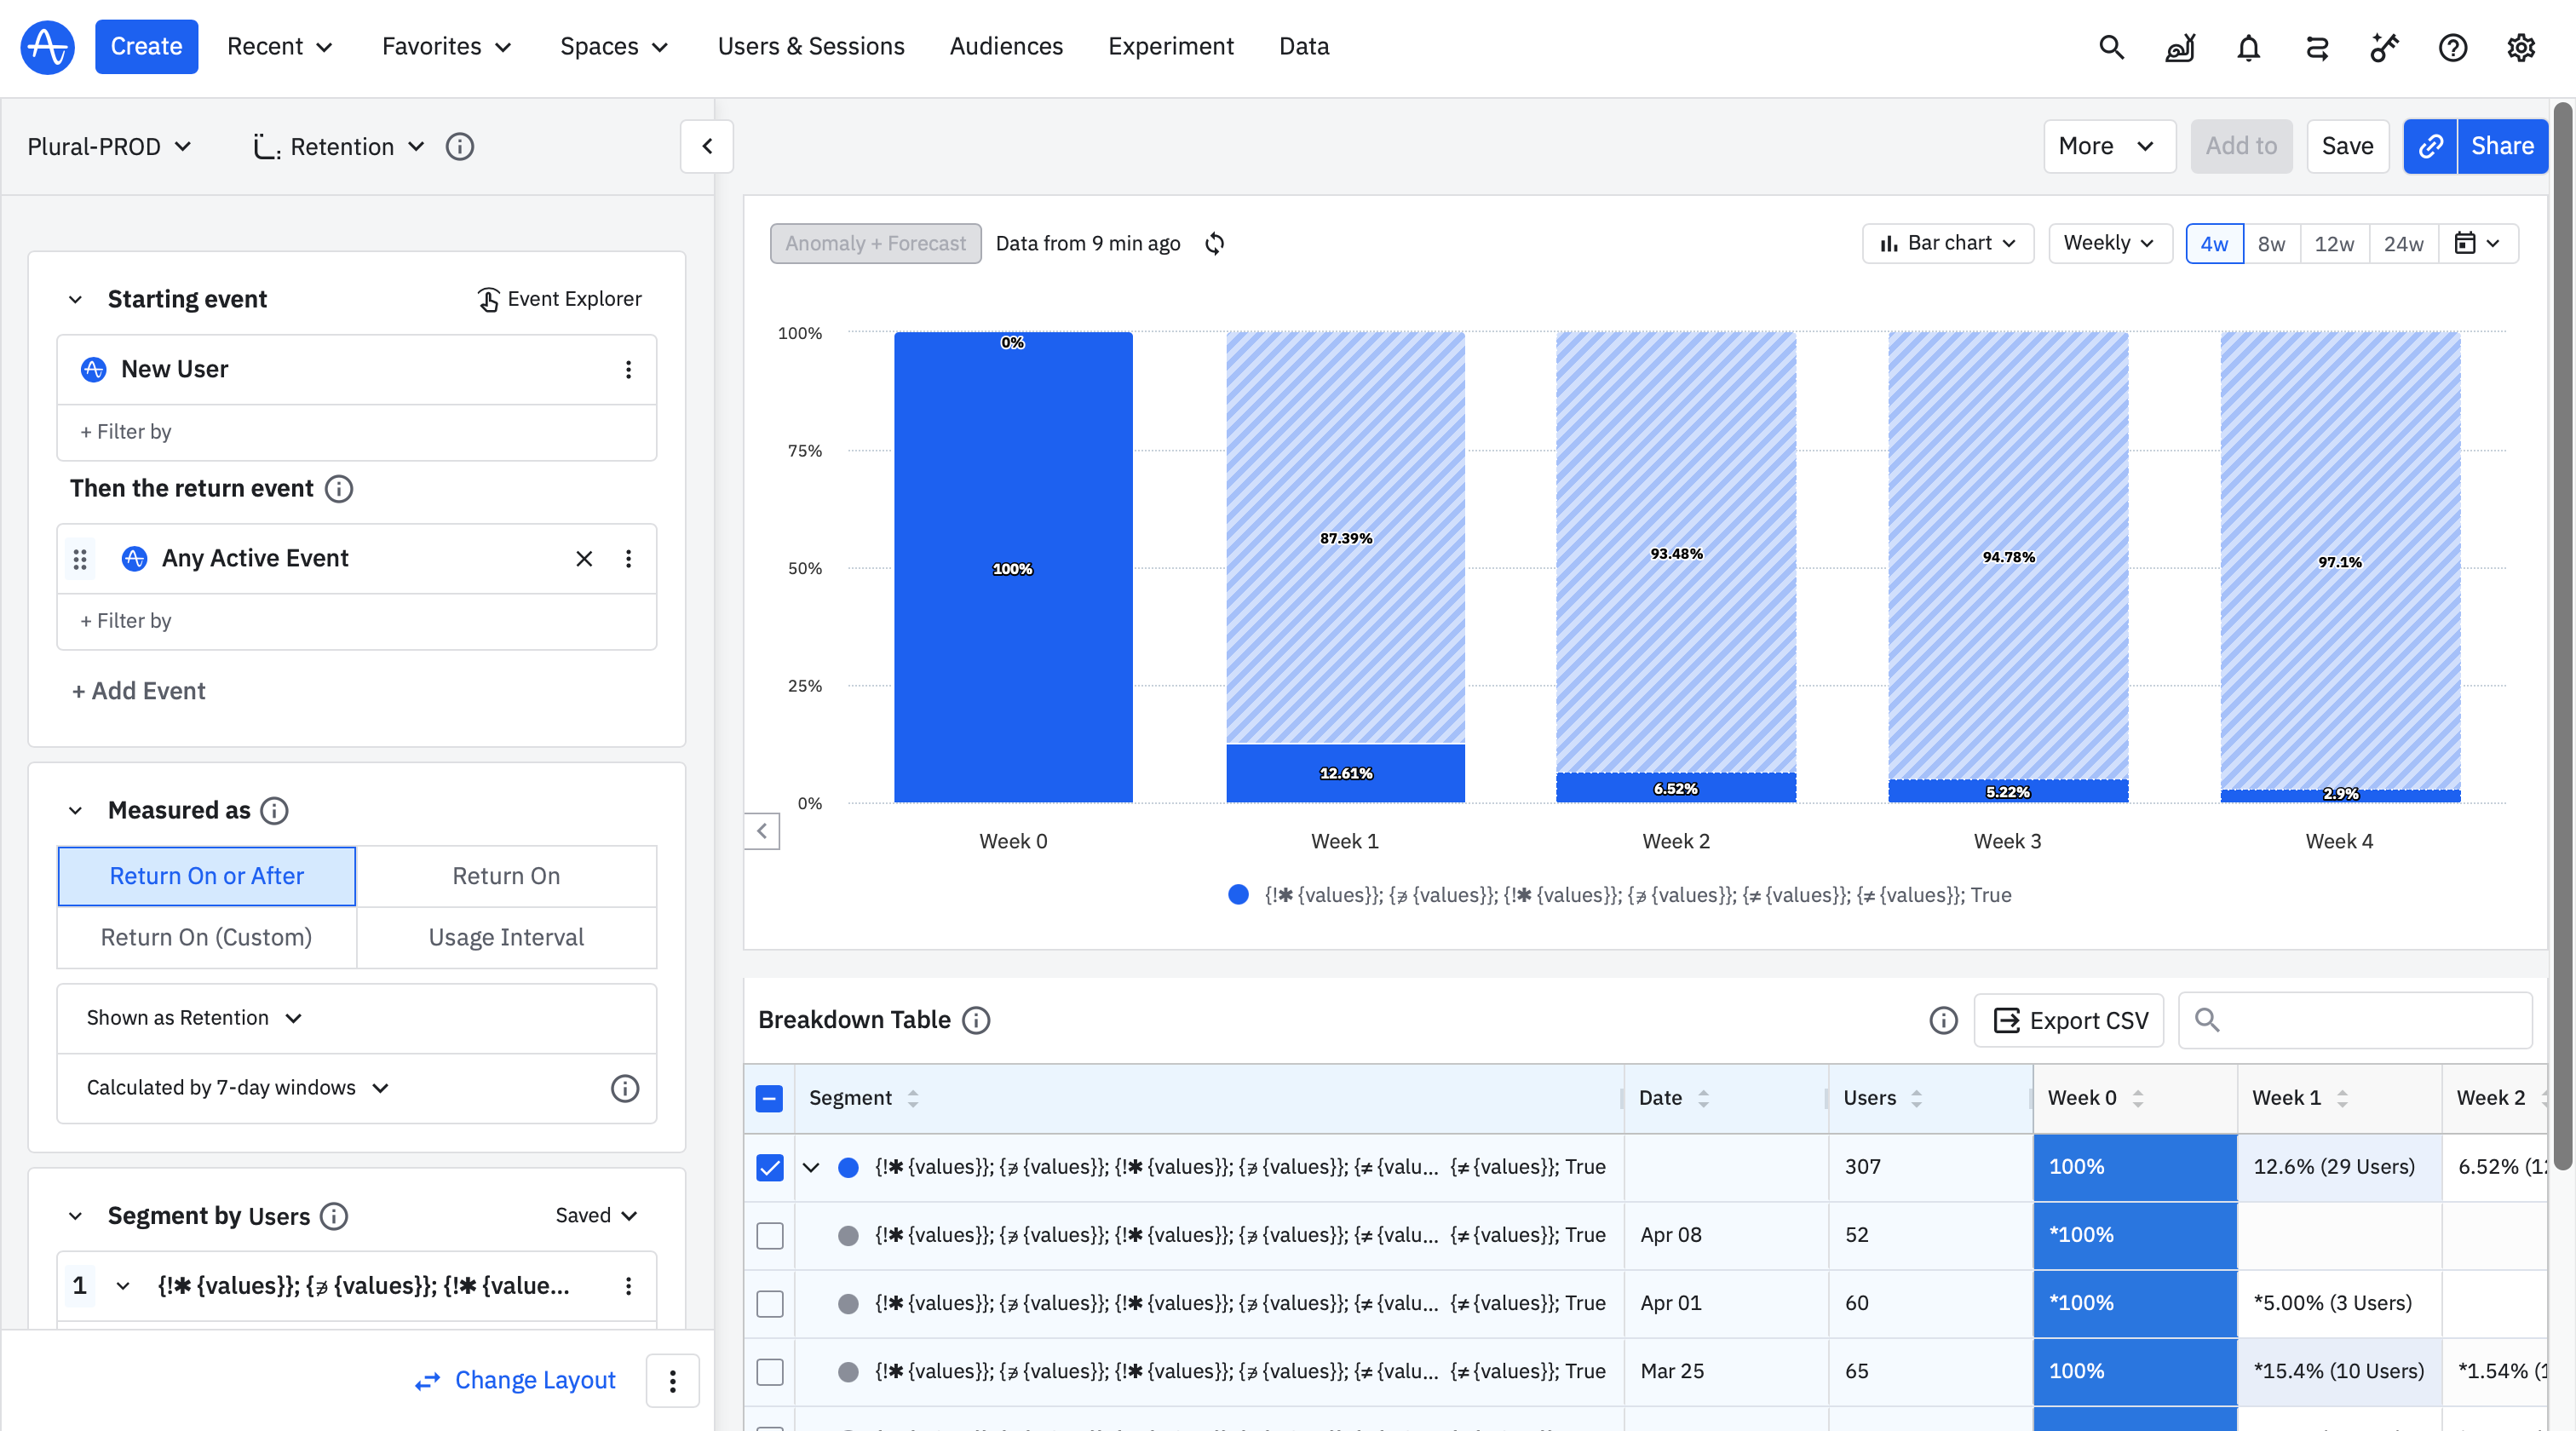
The way I’m reading this, the chart is telling me that:
- Over the past 4 weeks (time frame selected in the top right)…
- 5.22% of “New Users” (selected in “Starting event”) have completed “Any Active Event” (selected in “Then the return event”) in at least 3 out of 4 weeks (chart itself)
One clarifying question: is this 5.22% the group of users that have completed any active event within any of the 3 out of the past 4 weeks (e.g. weeks 1, 2, and 4) or is it the group of users that have completed any active event in 3 consecutive weeks (e.g. weeks 1, 2, and 3)?
Thank you for your help.

