Question

Evolution of a 5 day Revenue LTV over time

  • 20 October 2023
  • 6 replies
  • 92 views

Hey guys, 


I’m trying to create a chart to visualise the evolution of the 5 day LTV generated by clients over time. 

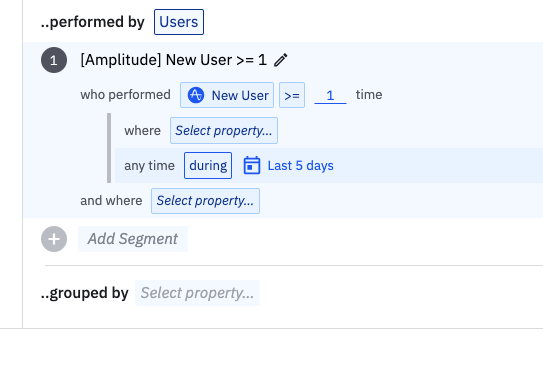
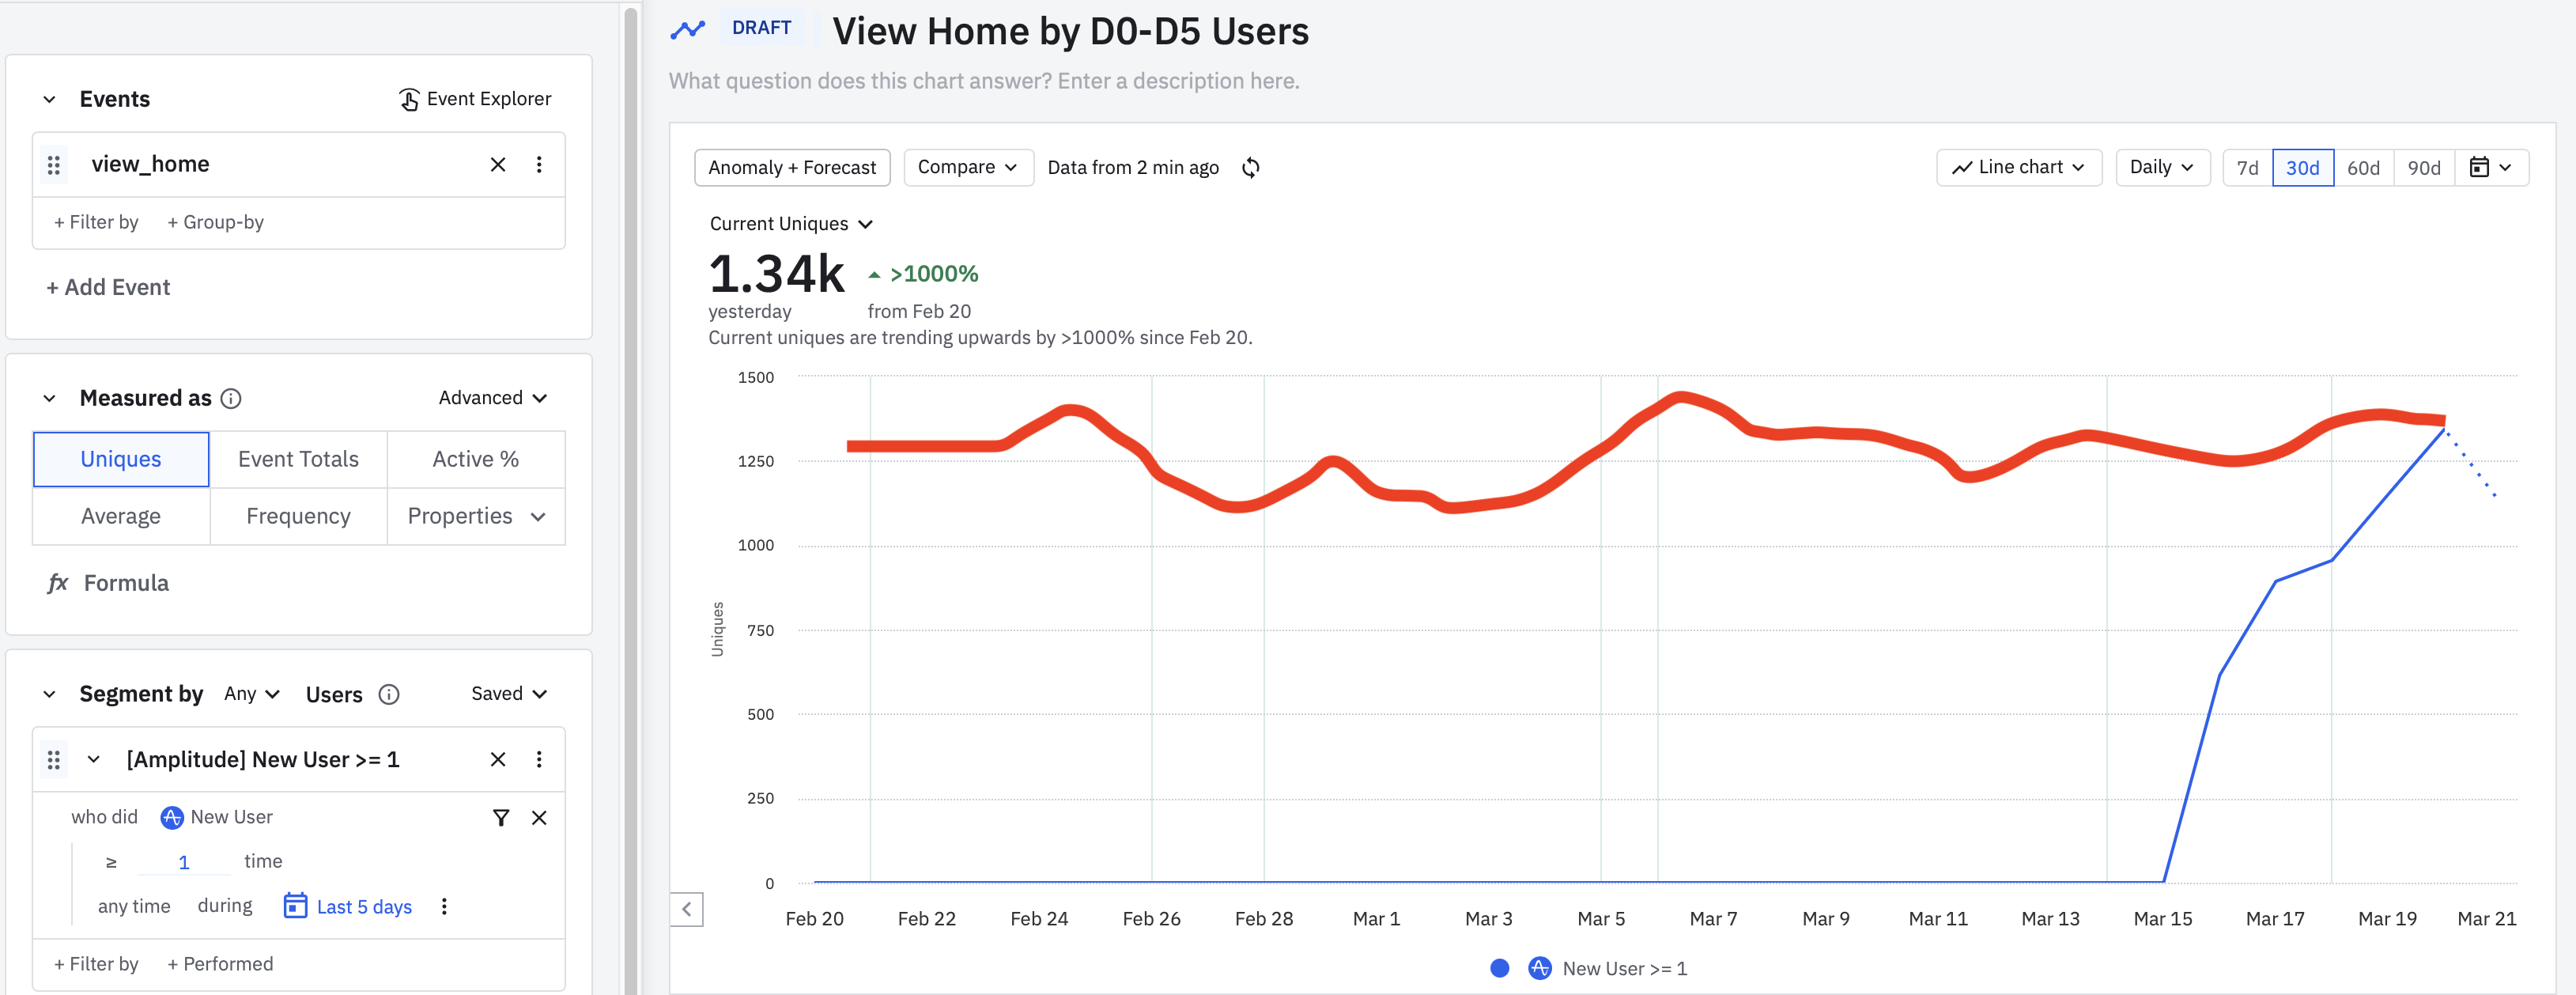
I have created a cohort for customers who subscribed the same week. I would like to plot the 5 day LTV of the cohort week 1, then the 5 day LTV of the cohort week 2… On the x-axis would be the cohorts (from week 1 of subscription until week n), and on the y-axis their 5 day LTV. 


Any ideas how I could do this ? 


Thanks ! 


Greg


6 replies

Userlevel 3
Badge +2

Hi @Grégoire Roquette , 

Sounds like you want to plot the change in 5-day LTV over time. That sounds awesome. I can’t figure out how to do it either, but I WANT to. 

What do you think @Saish Redkar? We can already plot and track the change in retention over time (a supported Amplitude feature), but tracking the change in 5-day (N-day) LTV over time would be great. Is this a new feature request? 

Anthony


Userlevel 3
Badge +2

You know what this reminds me of that we’ve needed for the last 12 years that would have also solved this issue... a “Custom New” option in the drop down for segmentation.

Rather than just “New” user in that time period, if we could select “New: First 5 days” then we could sum the revenue for for users new in the last 5 days. 

@Saish Redkar there’s no way to create a cohort to do this, right? The bosses are always asking about “How are D0-D2” users doing, but there’s no way in Amplitude to find D2 users only, isn’t that right?  


Userlevel 7
Badge +10

@Anthony I think that clause can be mimicked in this way?
 

So we just include users who were new in the past 5 days or so.

Userlevel 3
Badge +2

Thanks @Saish Redkar. That was worth a shot, but it doesn’t show the rolling chart over time of activity of users who are <5 days old when the event was triggered; it only shows users created in the last five days from TODAY. 

I’m trying to track the red line below (I drew a fake one in); not the blue line: 


 “New Users” works great for tracking D0 only users, but how can we track D0-D5 users or even “Week 0” users for that matter. Using “New Users” by “Week” uses calendar weeks and only gives users who joined on Saturday 1 day of activity (so it’s not helpful for daily tracking), but would be ideal to see daily rolling charts of User-Week-0 activity and revenue. 

Userlevel 3
Badge +2

I could create a new user property called “Days Since User Created” and set it to 0 on D0 and then update it every day. 

Userlevel 3
Badge +2

Hi @Grégoire Roquette @Saish Redkar

@Yosimy.Cortes confirmed that we will need to set this up manually.


Example Set Up

  1. Create a new user property days_since_user_created
  2. Set value to now() - user_date_created in days, rounding down to the nearest whole number.
    1. Result: For the first 24 hours, the value will be 0; for the next 24 hours the value will be 1, etc. 
  3. Then filter for days_since_user_created < 7 to track first 7 days of revenue.


Reply