Hi there,
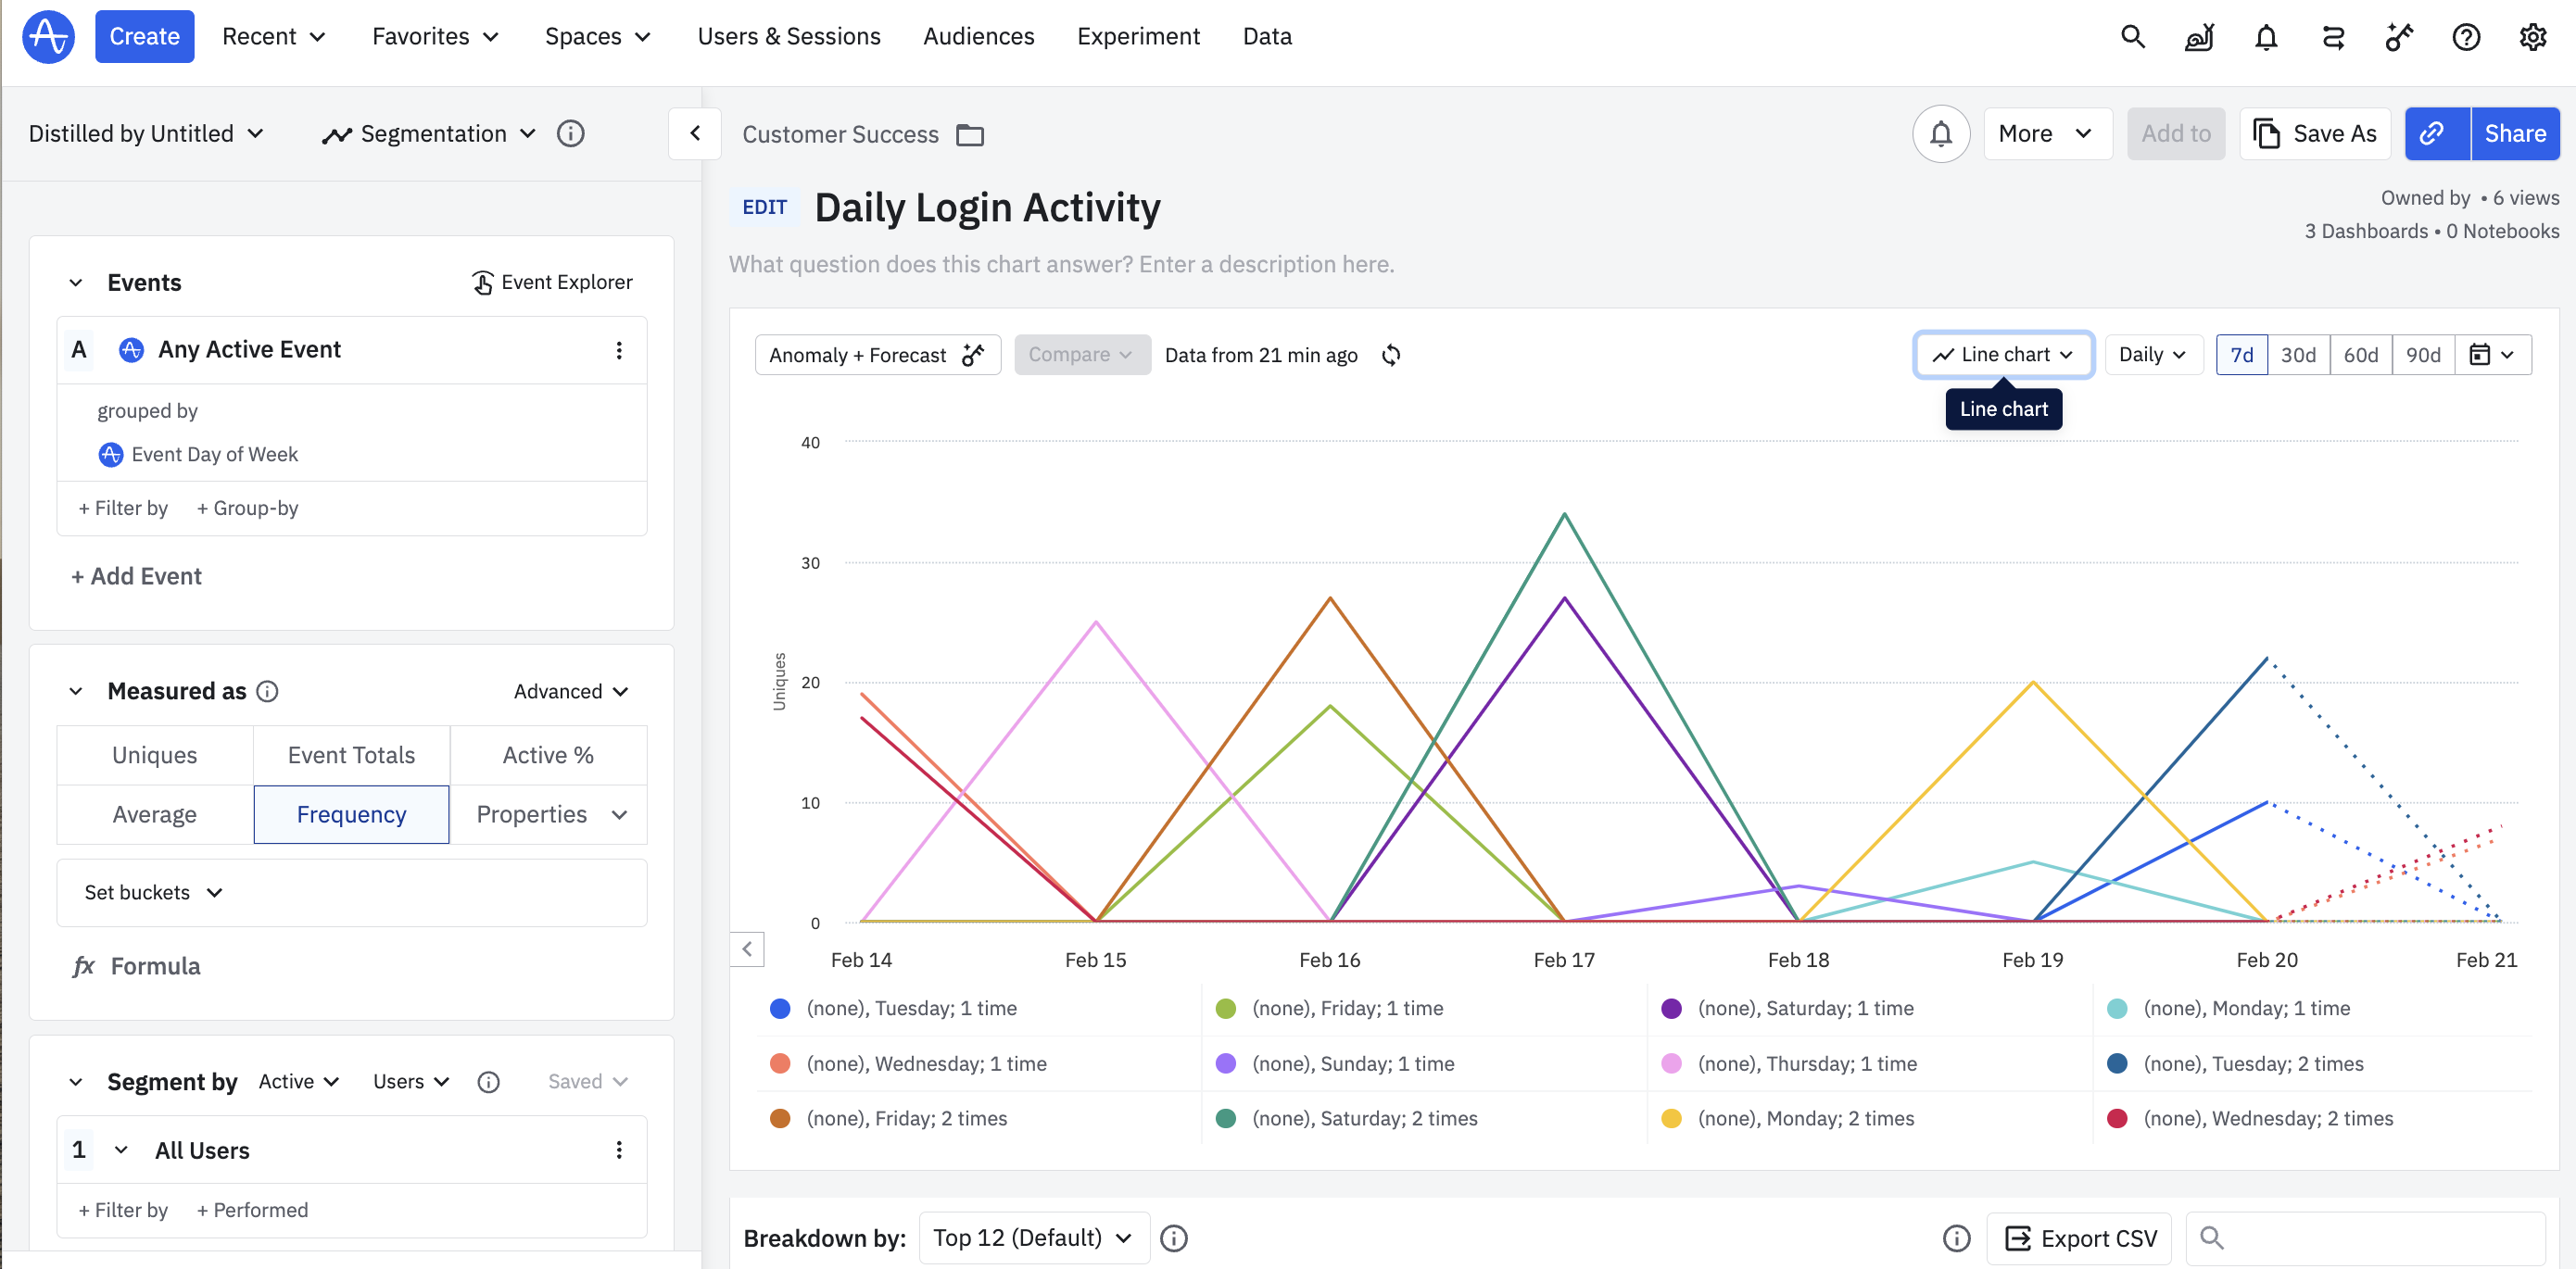
I am a beginner with the Amplitude platform - I am curious why the line graph for Daily Login Activity shows multiple lables of Monday, Tuesday, Wednesday, etc. and why there is a (none) associated to this activity.
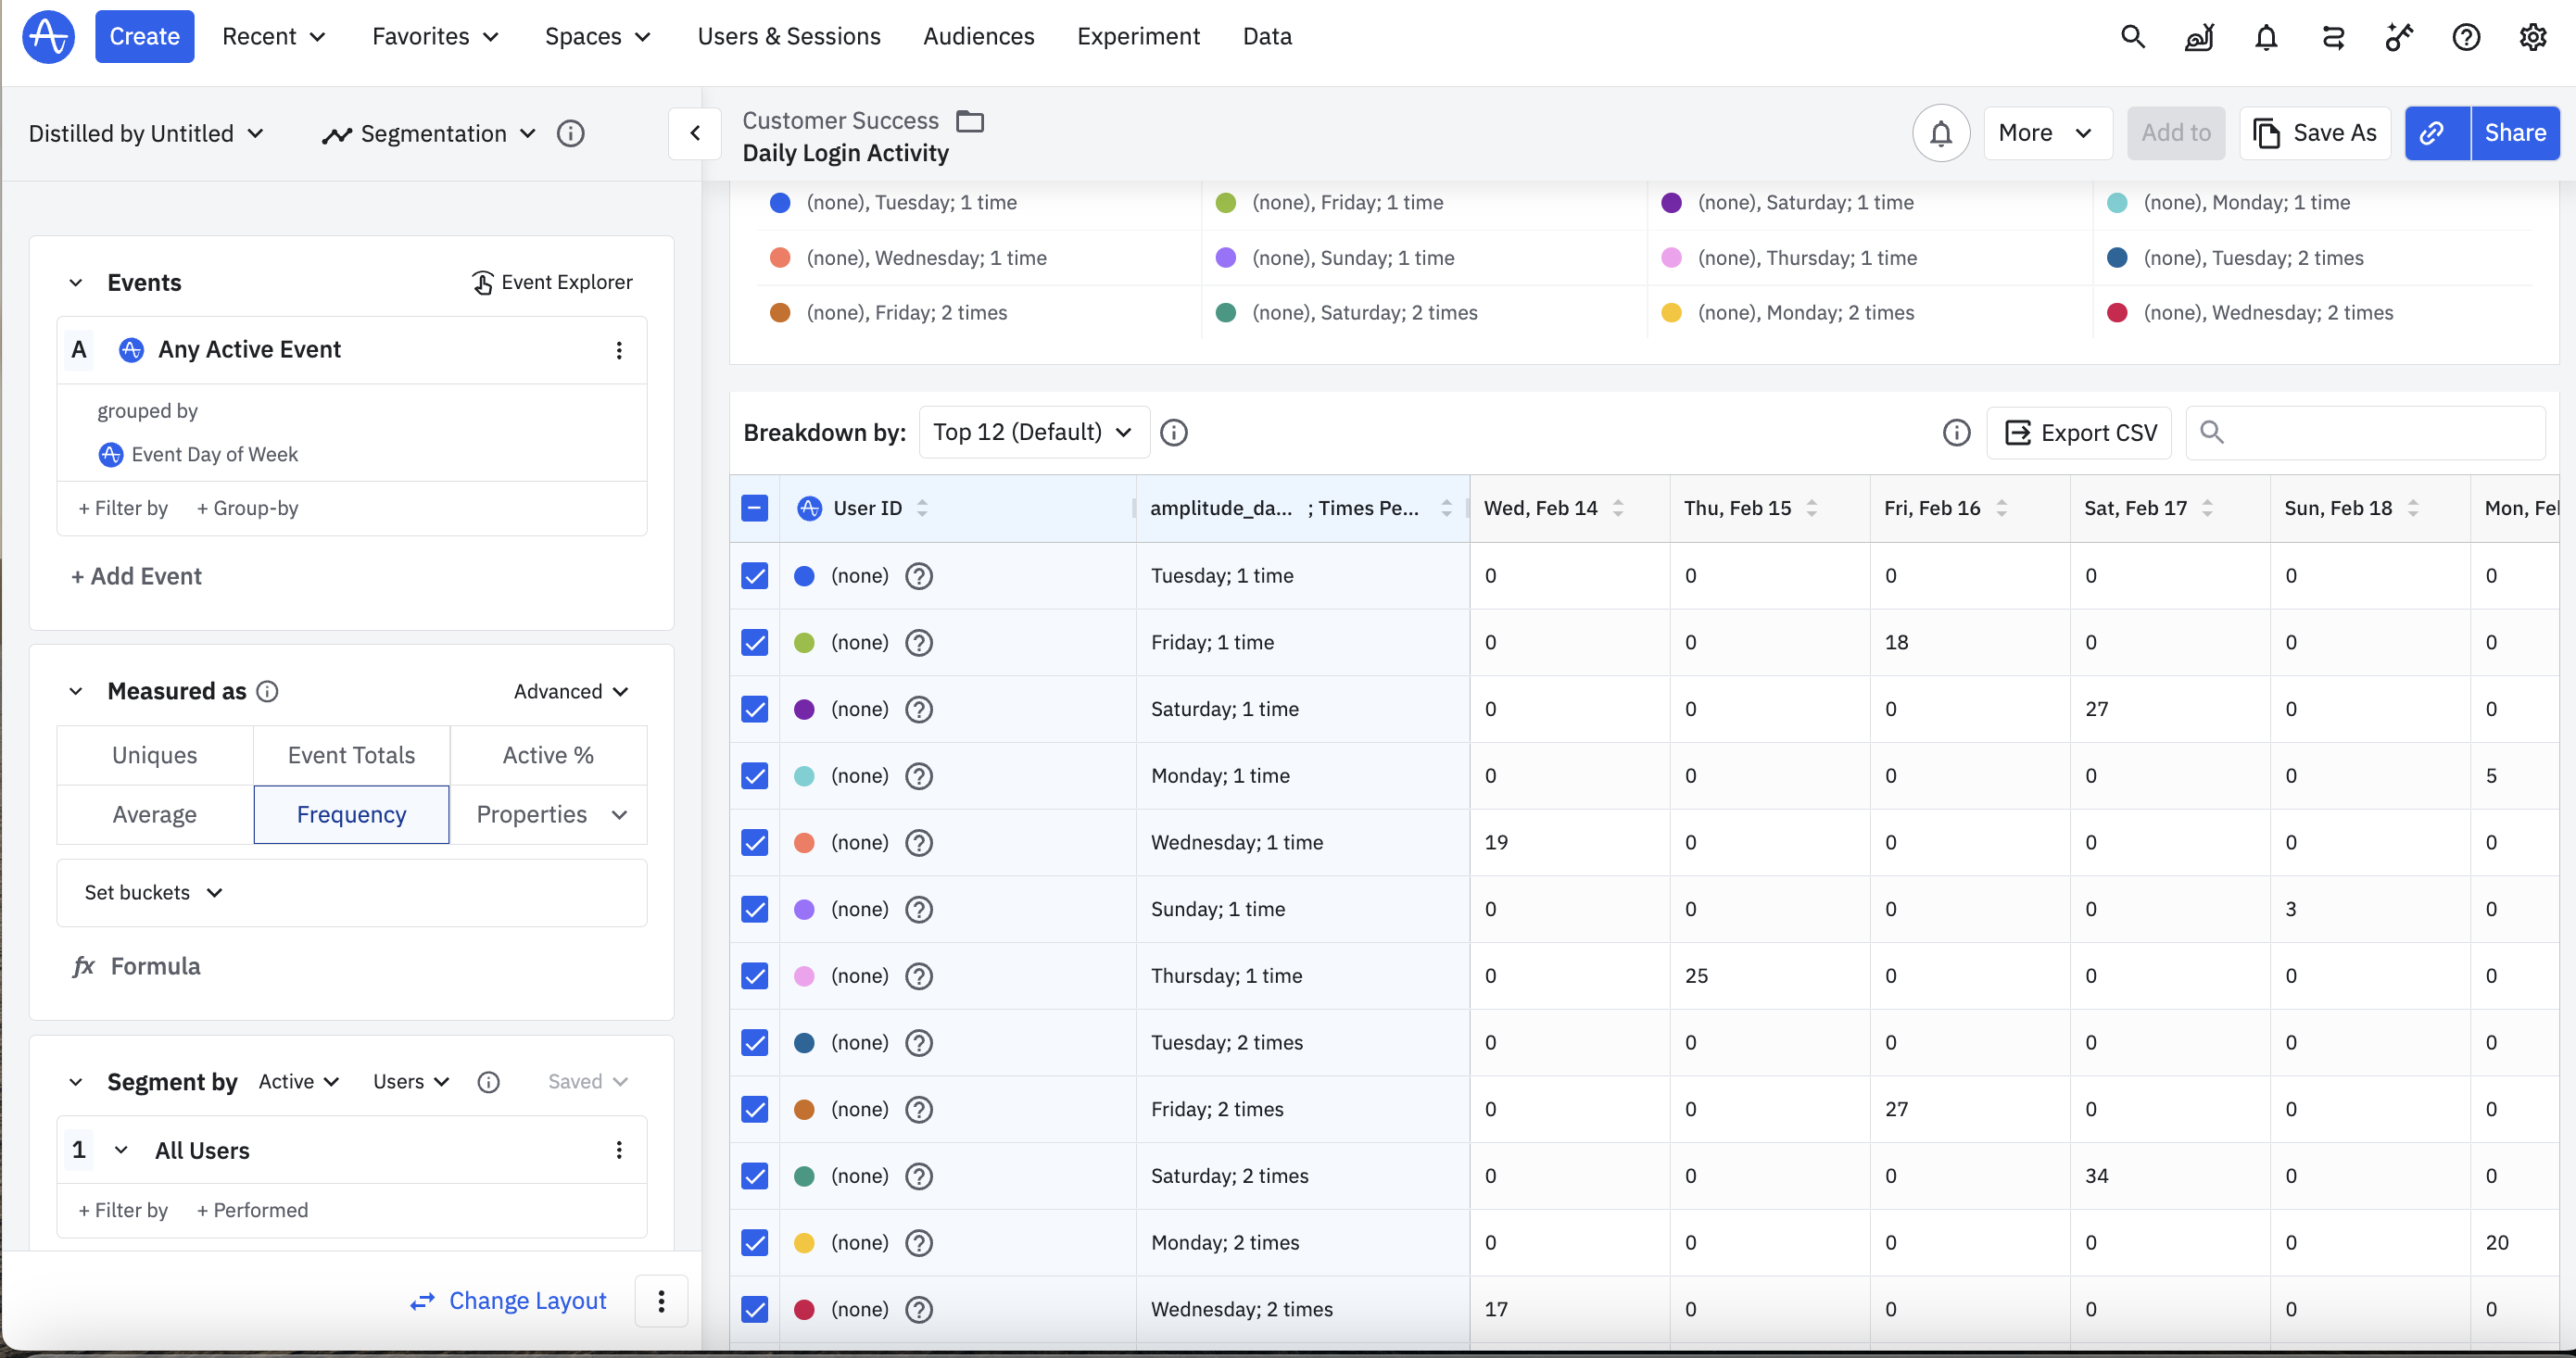
Also I’ve selected Frequency to measure this data but the number of logins that are displayed in the chart are different from the numbers in the line graph.
Thanks!

