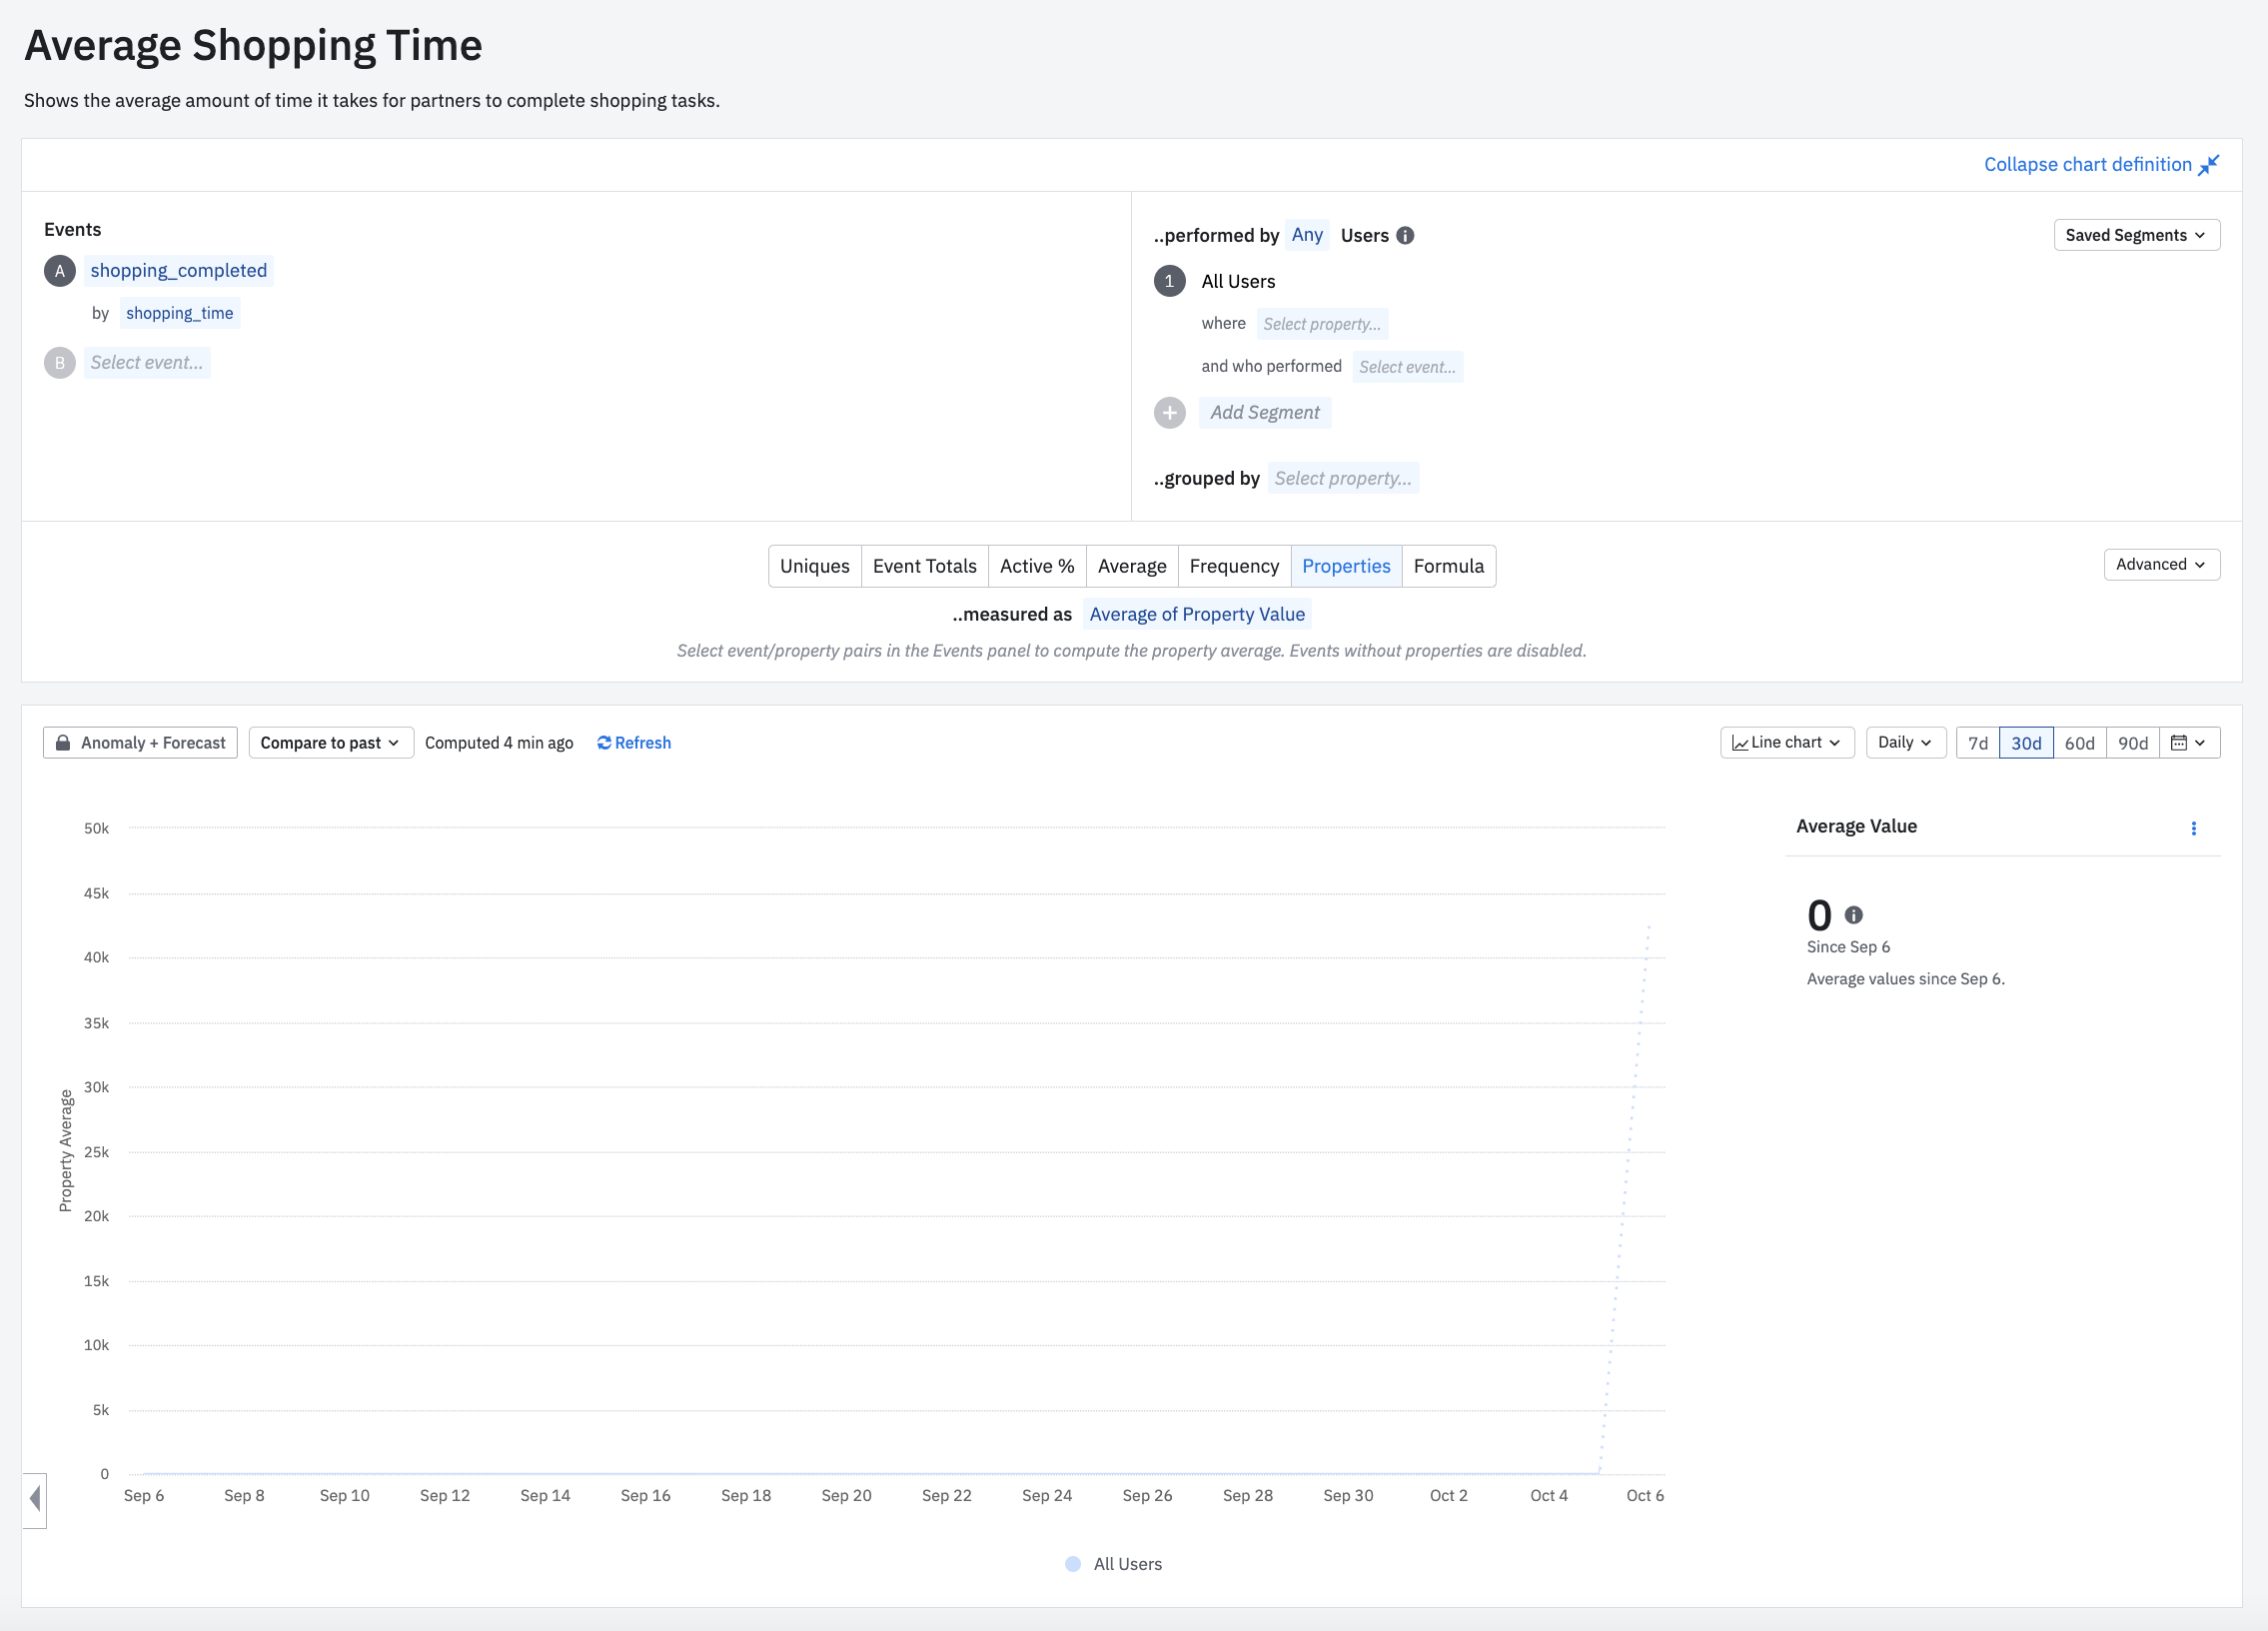
I’ve created a Segmentation graph that shows average shopping times. It takes a look at the shopping_time property of all shopping_completed events in a given day and plots the average of those values. I’m wondering if there is a way to apply a formula to the shopping_time values, which we are currently sending in milliseconds, so that we can show either seconds or minutes on the y-axis instead of what is currently milliseconds. Is this a possibility or do we just have to send the shopping_time values in whatever unit we are currently wanting to measure?
Two approaches might work in your case if you stick to sending the shopping_time value in milliseconds -
Use the derived property feature to create a property value in mins/sec and use it in your chart. This derived property will be computed on the fly and can be used in any chart [ part of the Govern Add-On ]
Use custom formula PROPAVG and convert each datapoint in aggregate into either seconds or minutes by arithmetic calculations. As seen in this chart - https://analytics.amplitude.com/demo/chart/new/bhx8kyu. This approach limited to custom formulas.
Let me know if I have interpreted your use case correctly. Hope this helps.
If you don't have an Amplitude account, you can create an Amplitude Starter account for free and enjoy direct access to the Community via SSO. Create an Amplitude account. You can also create a Guest account below!
If you're a current customer, select the domain you use to sign in with Amplitude.
If you don't have an Amplitude account, you can create an Amplitude Starter account for free and enjoy direct access to the Community via SSO. Create an Amplitude account. Want to sign up as a guest? Create a Community account.
If you're a current customer, select the domain you use to sign in with Amplitude.
We use 3 different kinds of cookies. You can choose which cookies you want to accept. We need basic cookies to make this site work, therefore these are the minimum you can select. Learn more about our cookies.