Solved

Something wrong with my retention

  • January 26, 2022
  • 1 reply
  • 380 views

I have 2 problems with retention graphics

  1. N-day retention shows me on N-day it’s 50% or bigger retention, BUT on 0 day there were 90 users in cohort and on N-day returned only 2 of them. How is it possible 2 of 90 - 50%?
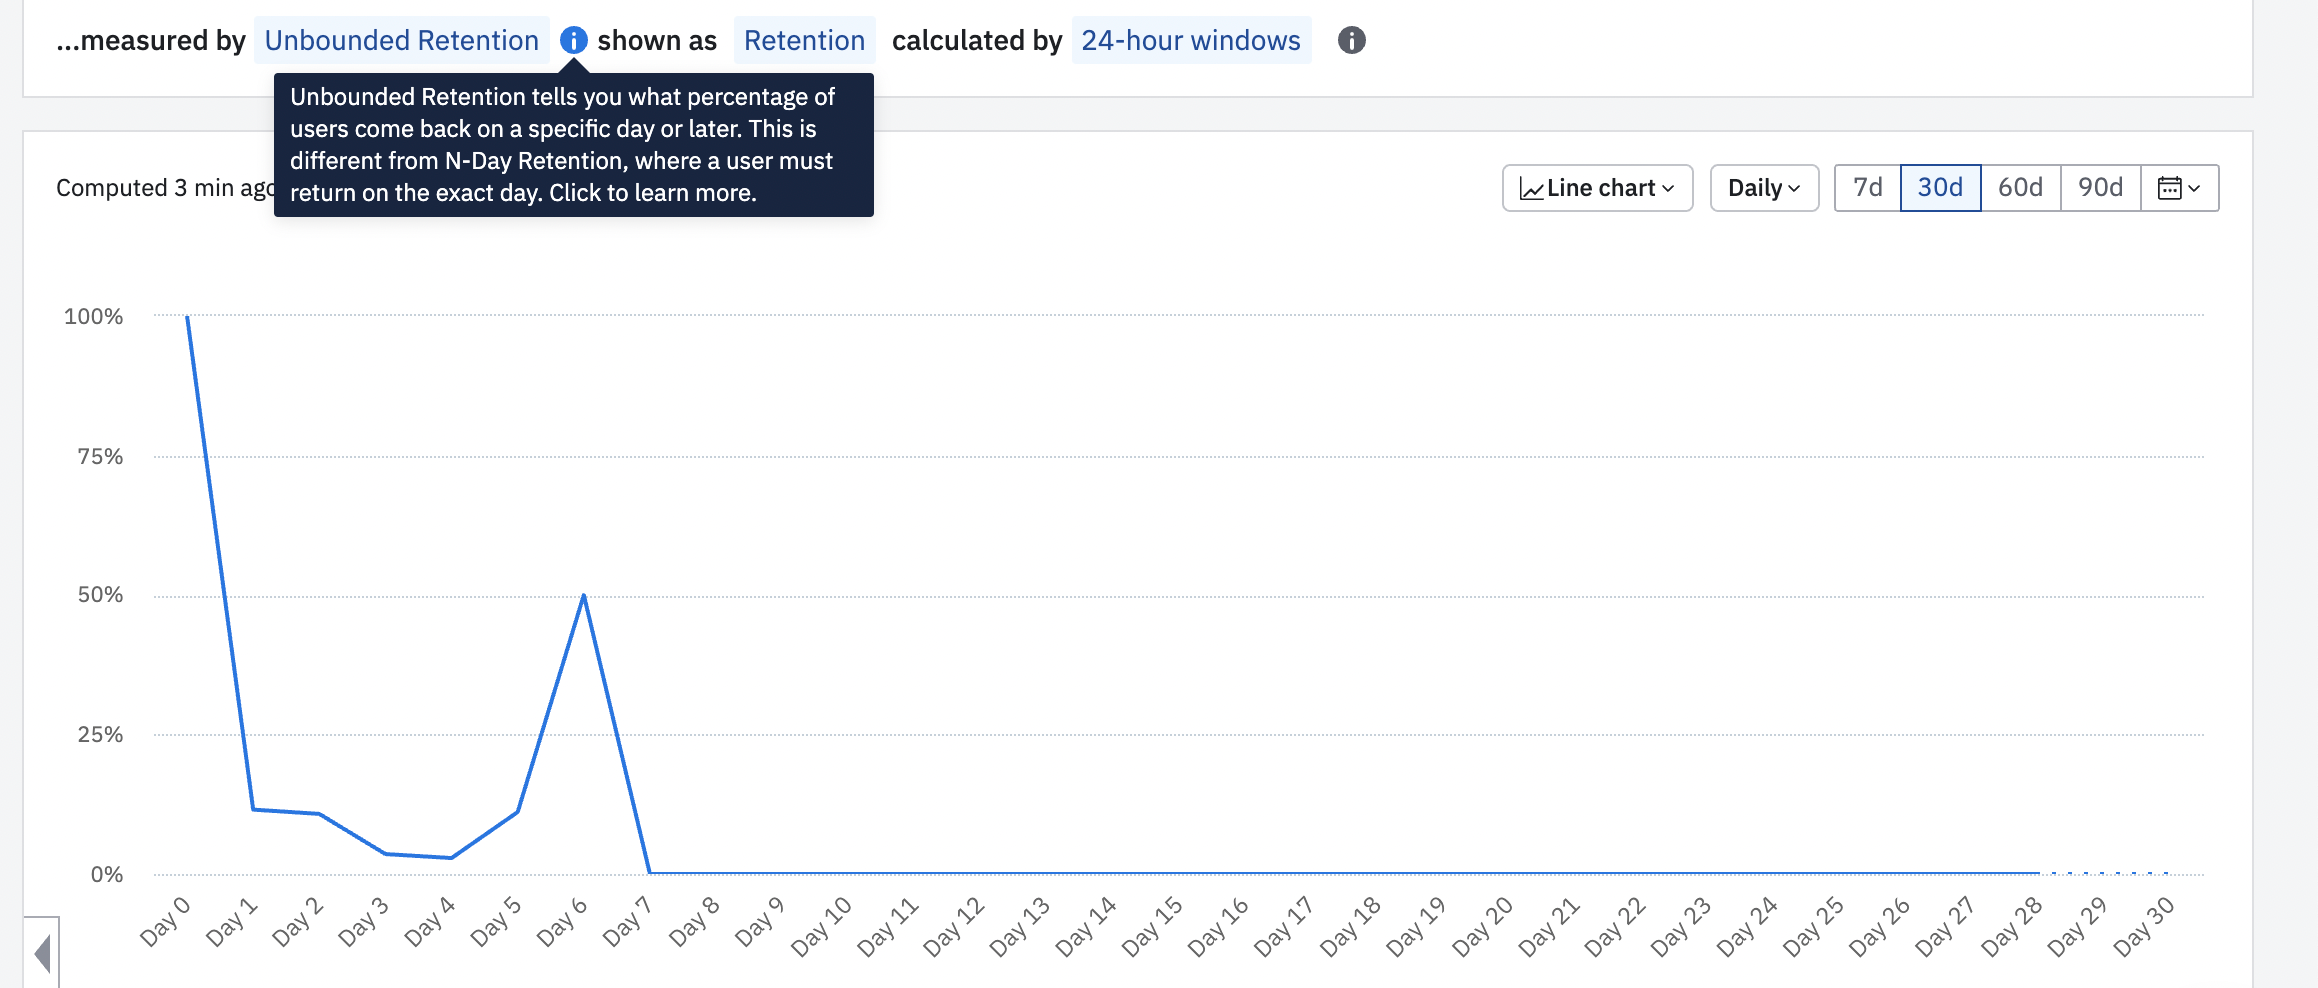
  2. Then I decided to check unbounded retention and it’s defenetly broken. If I’m not wronged, unbounded retention can not show us 10% on day 4 and 50% on day 5

Is it something wrong with our events? But we send them and it works.

How can I fix it?


Best answer by Saish Redkar

Hey @Anna Tsilind 
One of the common reasons for this chart’s funkiness is that the selected timeframe could have incomplete data points, owing to the uneven user counts within each day.

Here are some posts which you can dive into to get an in depth understanding-

[Retention] Why does the Retention curve go up?

Inconsistent W1 Retention in 4W vs 8W

[Retention] How is Retention Calculated? (N-Day Retention)


Hope these help!


View original
Did this topic help you find an answer to your question?

1 reply

Saish Redkar
Expert
Forum|alt.badge.img+10
  • Expert
  • 1377 replies
  • Answer
  • January 26, 2022

Hey @Anna Tsilind 
One of the common reasons for this chart’s funkiness is that the selected timeframe could have incomplete data points, owing to the uneven user counts within each day.

Here are some posts which you can dive into to get an in depth understanding-

[Retention] Why does the Retention curve go up?

Inconsistent W1 Retention in 4W vs 8W

[Retention] How is Retention Calculated? (N-Day Retention)


Hope these help!


Reply


Cookie policy

We use cookies to enhance and personalize your experience. If you accept you agree to our full cookie policy. Learn more about our cookies.

 
Cookie settings