Hey @rahulsekhar
The frequency metric might help as Denis suggested if a user attends a unique session only once, but the bucketing might not be possible.
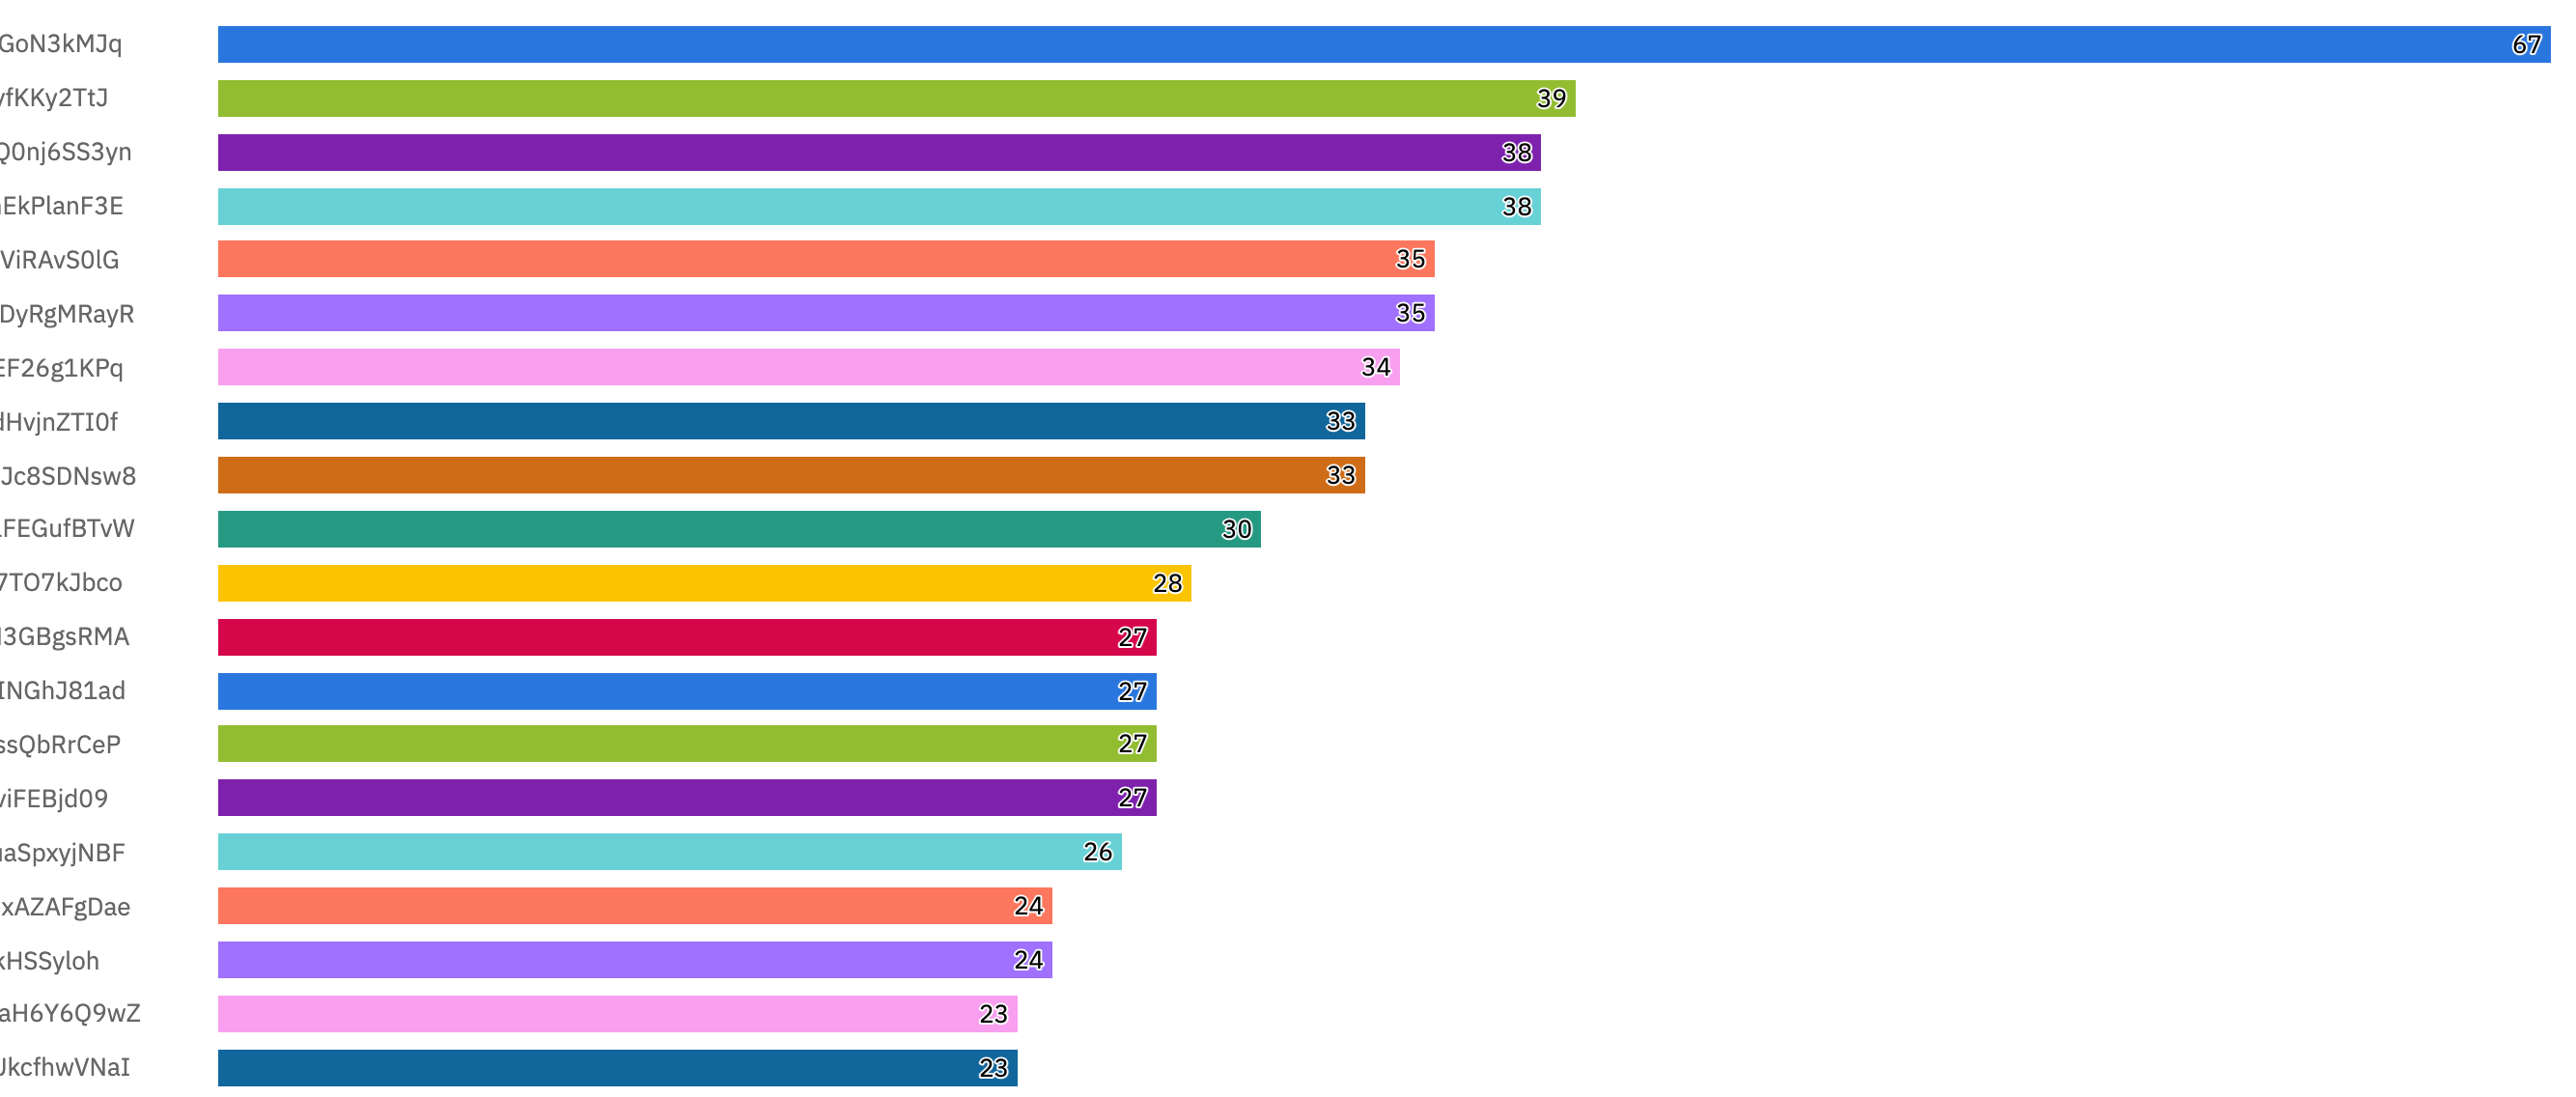
I’m assuming this is an “Attended Session” event on a user level with the session ID ( more like the session’s unique meeting ID I believe to avoid confusions with a user session ) and you are grouping by the session ID to get this chart?
From what I see, this schema might not help much in answering your question.
Do you have any event instrumented when a session gets completed? This might have to be a standalone admin kinda event to get the desired results instead of per user.
e.g “Session Complete” with an event property of #_attendees.
Using this schema , you can use try using the Distribution of Property Value metric in the event seg chart to get the answer.
Similar to a Song Played event with duration property distribution as seen here , with #_attendees as the property you wish to see the distribution for.
Also, it seems like sessions is a “group” which seems to have different attributes that you are trying to answer questions for. I would recommend looking into instrumenting your sessions as a group if that helps better for your various use cases.
Let me know if I’m missing some additional context here.