Hi all!
I’m new to Amplitude. Just tried to push some data and I was successful. I’m especially interested in the event_properties and how I can create some expressive charts around them.
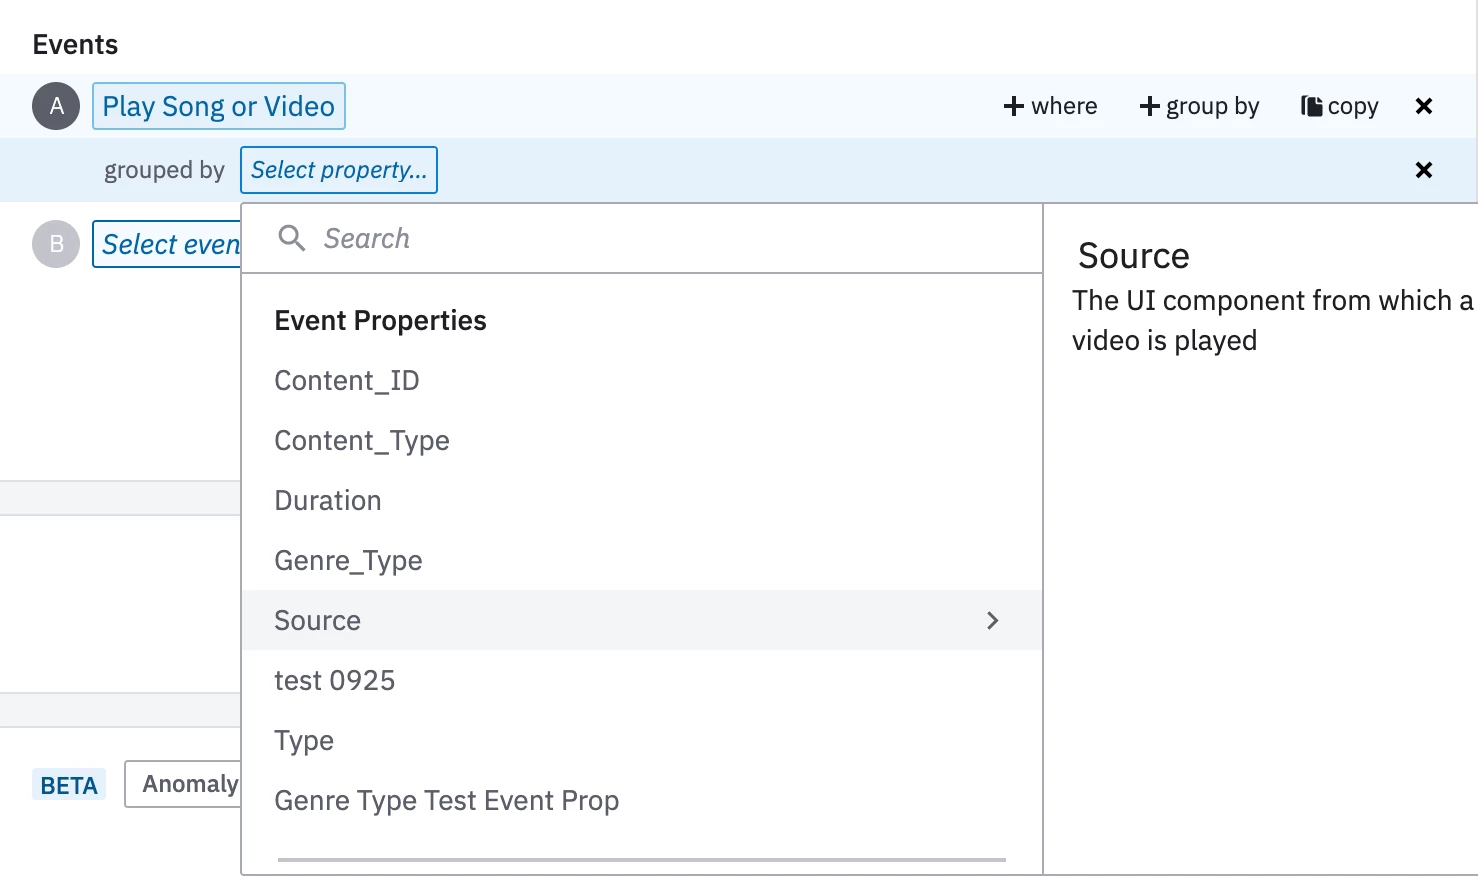
However, I don’t see any options to “group by property_x”?
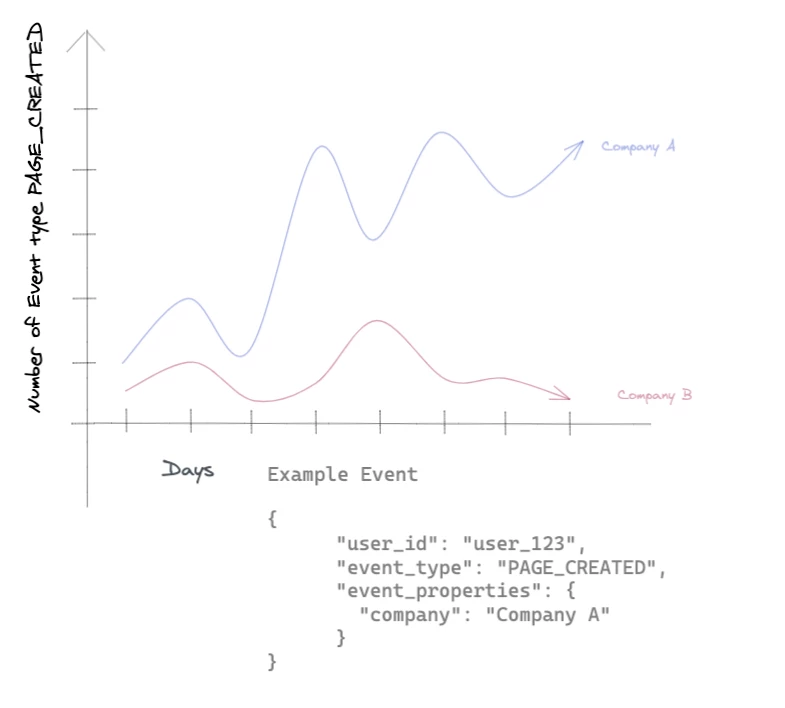
For example, let’s say I store a event property“company” for a user. How can I make a chart to group the events by company, so I know which company did create how many events on a daily / weekly level?
Here is a sketch :)
Can you advise?
Thank you!
Lukas