Solved

Stickiness Graph: How can I interpret the day 1 percentage, if I set the events to any active event?

  • October 27, 2022
  • 1 reply
  • 333 views

Forum|alt.badge.img

Hey everyone,

I created a stickiness graph and set the event = any event. 
My two questions are:

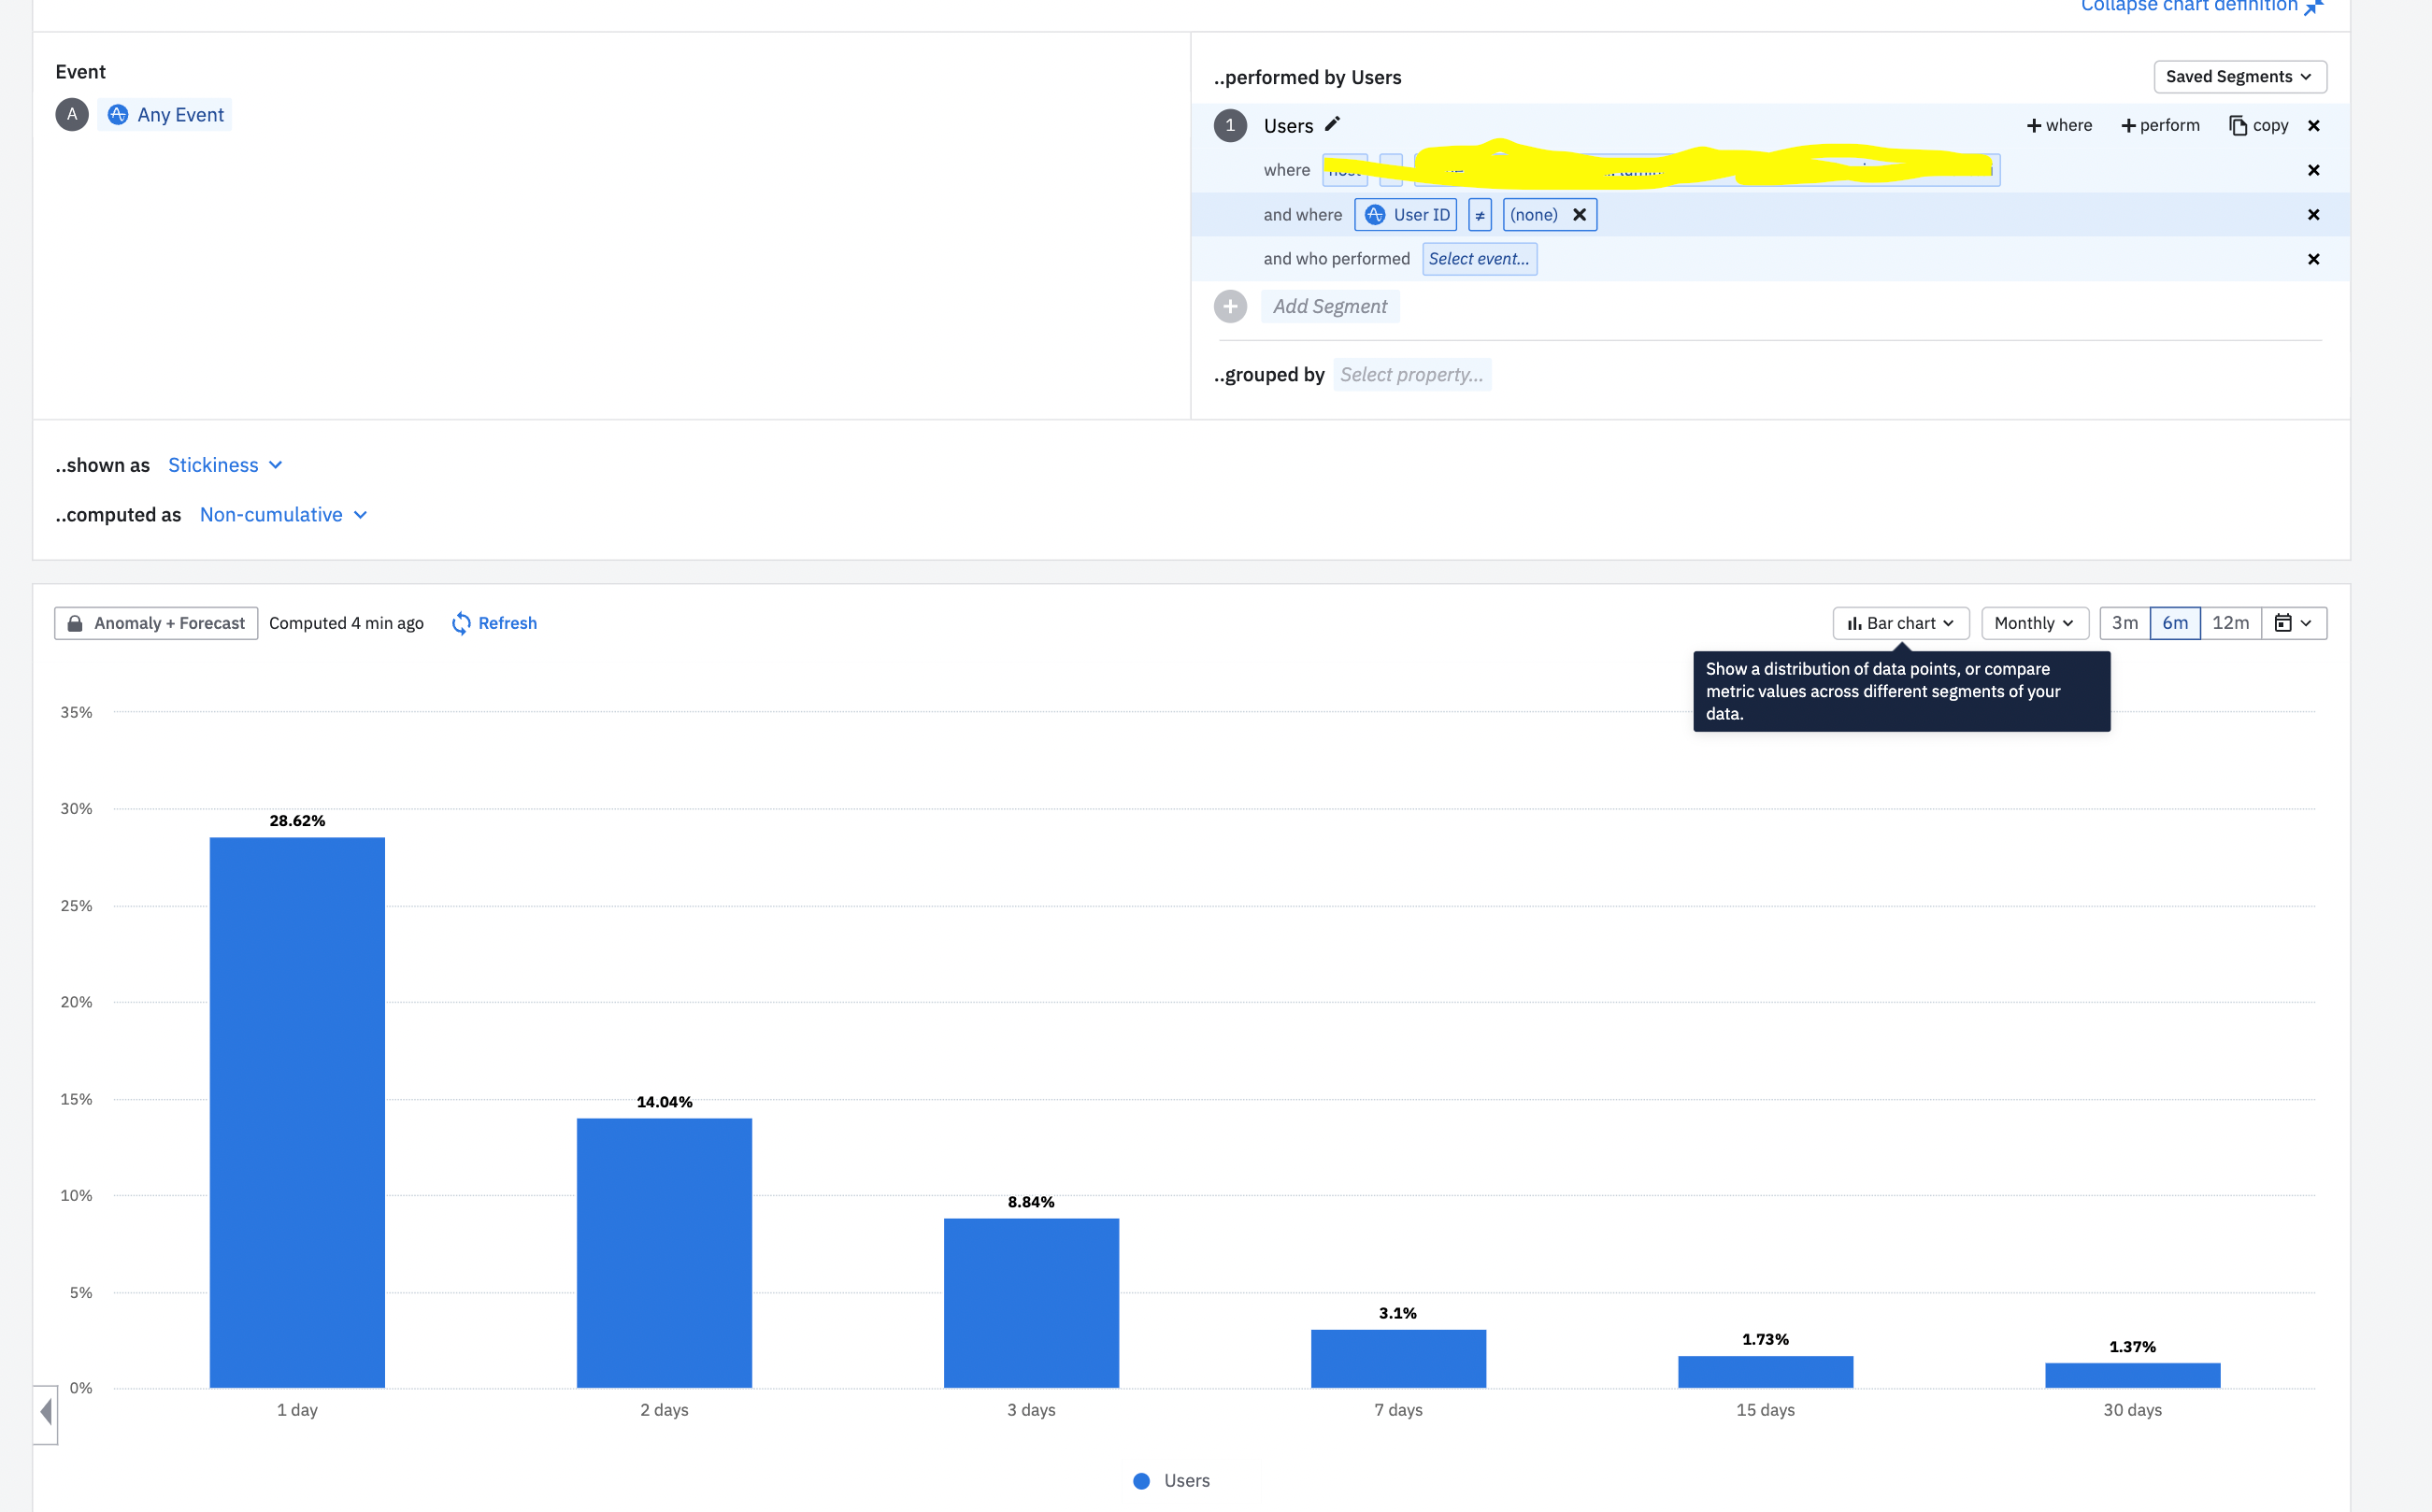
  1. Why can I only see 6 days in the bar chart view?
  2. What learning can I draw when the event is set to any event and my 1 day bucket is at 29%? Does this mean my users perform a lot of events which I am not tracking yet?

As always looking forward to your replies :) 
 

Best answer by timothy-permutable

Hi! Can I ask what question you are trying to answer about your users? Then maybe I can better guide your setup of the stickiness chart.

In short, with the current settings you have, the chart is saying that 29% of the users who fire an event only fire an event on a single day.


In general I would recommend that you use “any active event” with the stickiness chart. You might have inactive events - I think it’s unlikely you want to include those in a stickiness analysis.

View original
Did this topic help you find an answer to your question?

1 reply

timothy-permutable
Super Helper
Forum|alt.badge.img+10

Hi! Can I ask what question you are trying to answer about your users? Then maybe I can better guide your setup of the stickiness chart.

In short, with the current settings you have, the chart is saying that 29% of the users who fire an event only fire an event on a single day.


In general I would recommend that you use “any active event” with the stickiness chart. You might have inactive events - I think it’s unlikely you want to include those in a stickiness analysis.


Reply


Cookie policy

We use cookies to enhance and personalize your experience. If you accept you agree to our full cookie policy. Learn more about our cookies.

 
Cookie settings