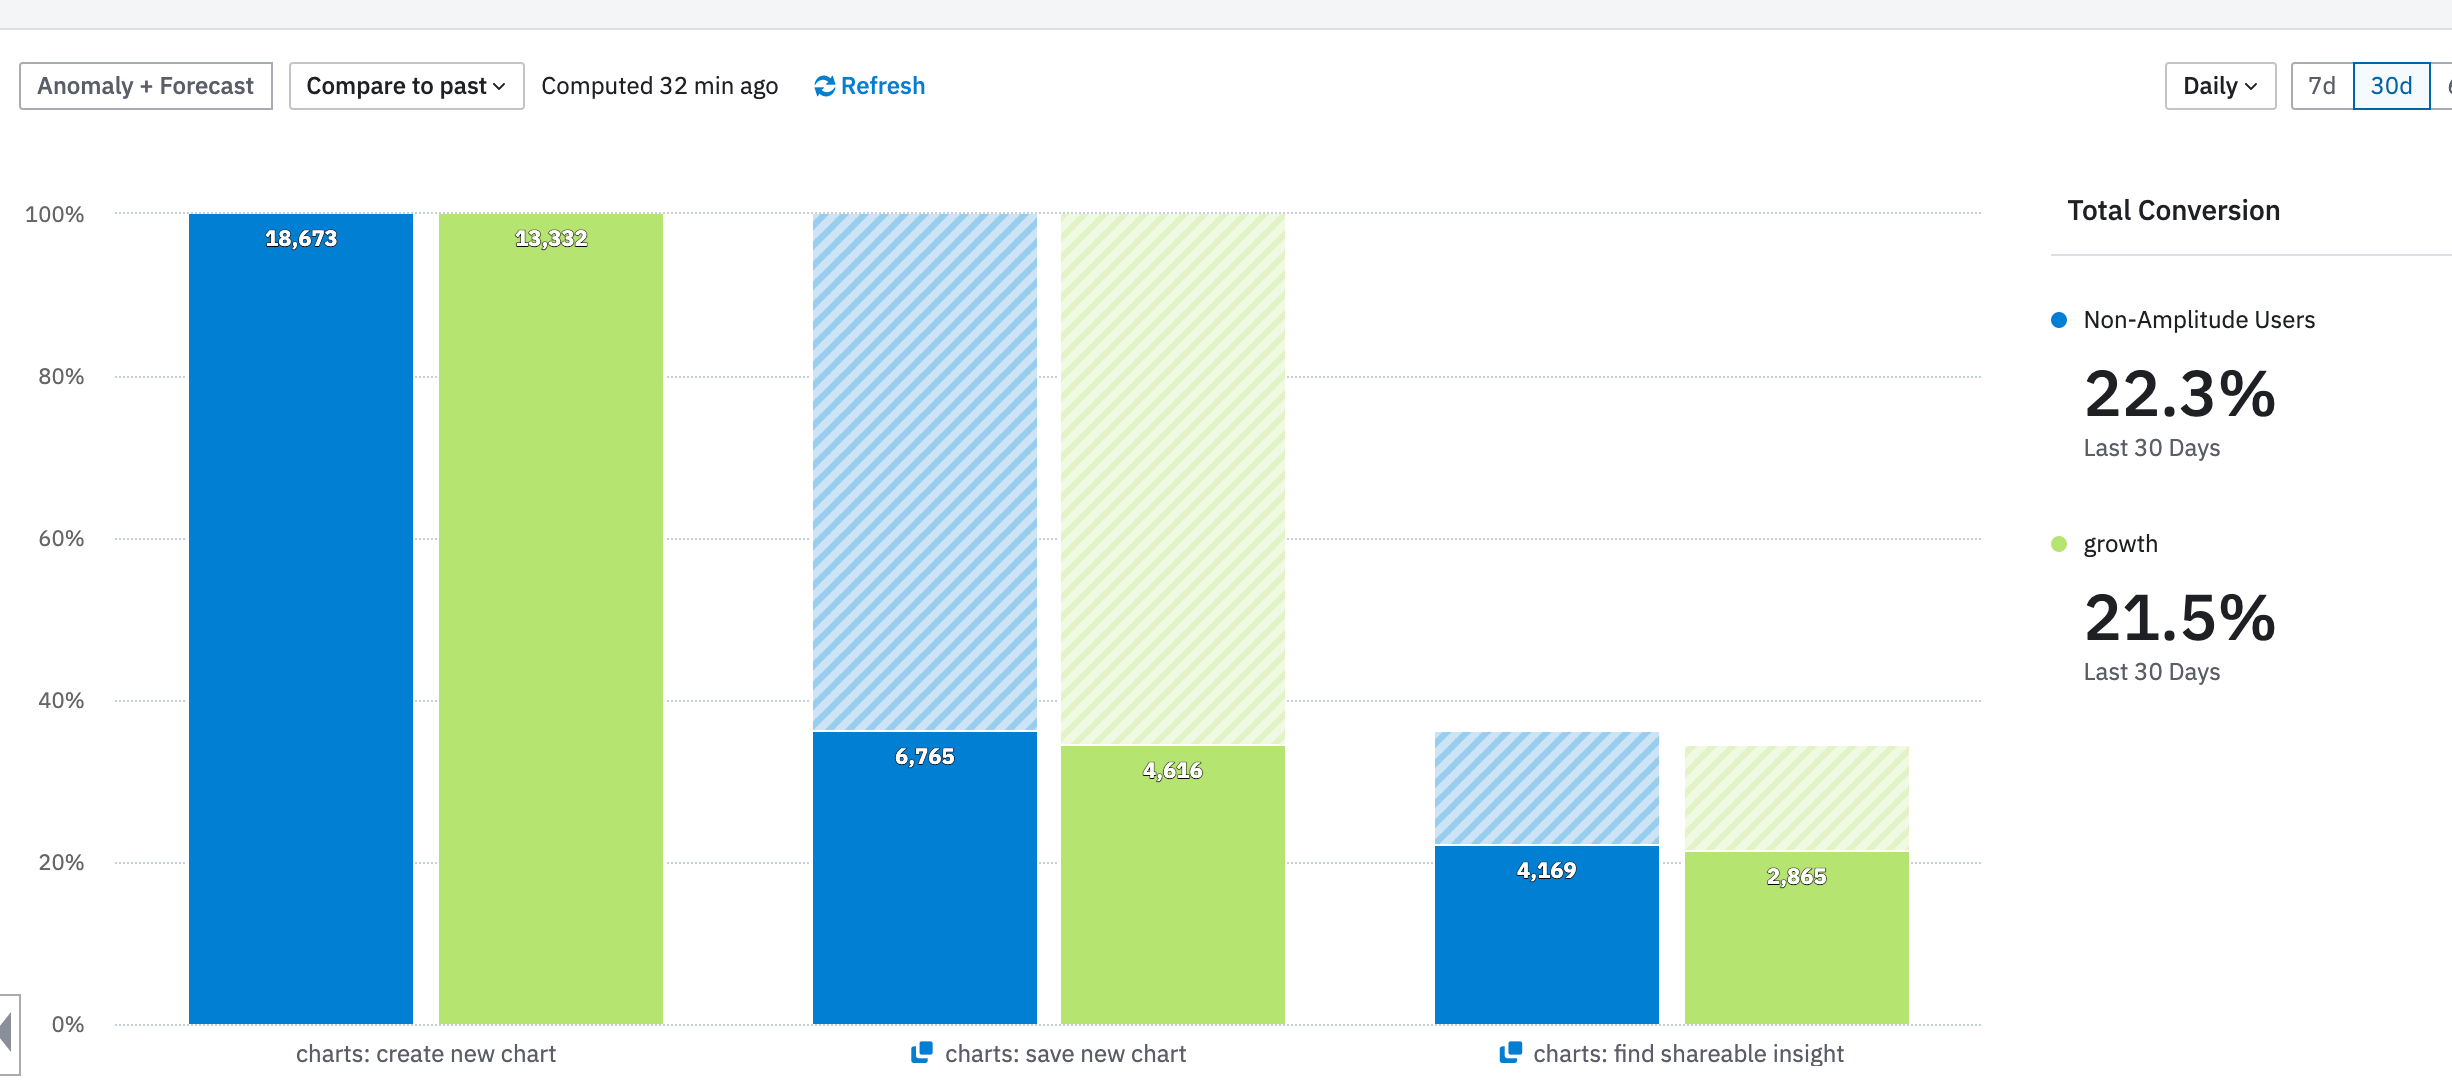
Charts in Amplitude aren’t always intuitive - to understand rates of change or improvements over baseline often requires mental math, a ruler, or a calculator. Chart Takeaways offer summary statistics beside funnel and event segmentation charts, to make it easier easier to comprehend the meaning and implications of the data!

Chart Takeaways

 +2
+2Be the first to reply!
Reply


Welcome to the Amplitude Community!
If you don't have an Amplitude account, you can create an Amplitude Starter account for free and enjoy direct access to the Community via SSO. Create an Amplitude account. You can also create a Guest account below!
If you're a current customer, select the domain you use to sign in with Amplitude.
analytics.amplitude.com analytics.eu.amplitude.comor
Welcome to the Amplitude Community!
If you don't have an Amplitude account, you can create an Amplitude Starter account for free and enjoy direct access to the Community via SSO. Create an Amplitude account. Want to sign up as a guest? Create a Community account.
If you're a current customer, select the domain you use to sign in with Amplitude.
analytics.amplitude.com analytics.eu.amplitude.comor
Enter your E-mail address. We'll send you an e-mail with instructions to reset your password.