I have a device on which I connect 3 USB Cameras named : Front, Left, Right.
There will be definately be charts based on the event_type and event_properties.
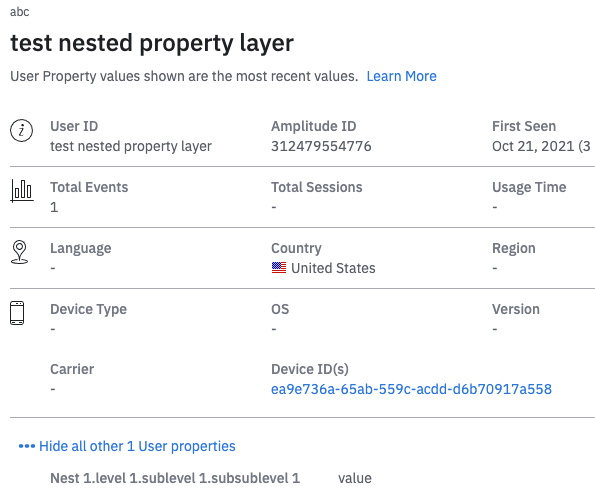
But, here I am interested in charts that I can create from User Properties.
The User(or device) Properties in any event, may have attached usb array object as below :
{
  "device_id": "C8F9E604-F01A-4BD9-95C6-8E5357DF265D",
  "event_type": "Camera started",
  "event_properties": {
    "camera_name": "Left"
  },
  "os_name": "Android",
  "os_version": "4.2.2",
  "device_brand": "Verizon",
  "device_manufacturer": "Apple",
  "device_model": "iPhone 9,1",
  "firmware_version": "02.04.10.22",
  "usbPeripherals": [
    {
      "cameraCapable": true,
      "microphoneCapable": true,
      "speakerCapable": false,
      "name": "Left",
      "model": "C635",
      "vendor": "Logitech"
    },
    {
      "cameraCapable": true,
      "microphoneCapable": false,
      "speakerCapable": false,
      "name": "Front",
      "model": "DS-0021",
      "vendor": "Hikvision"
    },
    {
      "cameraCapable": true,
      "microphoneCapable": false,
      "speakerCapable": false,
      "name": "Right",
      "model": "JC-20",
      "vendor": "Jabra"
    }
  ]
}
Is this event structure possible and useful to create below charts?
If not , What can be done differently in event structure for below charts?
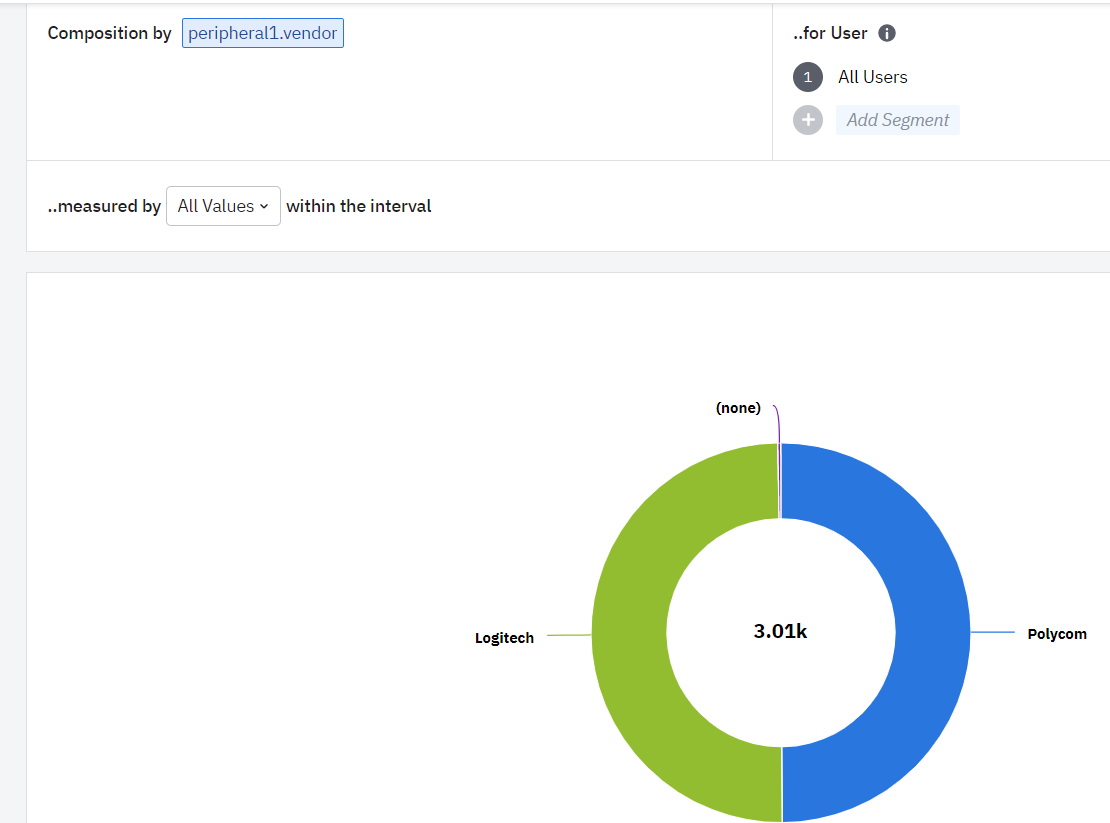
Can I create chart say showing distribution of vendors of all camera plugged into across devices and see camera-only vs other peripheral ?
Can I create a chart showing growth of a particular or top 5 camera vendors over time ?