


Available on the Scholarship, Growth, and Enterprise plans.
Product metrics fluctuate on a daily basis, and it’s hard to know whether changes accurately reflect your customer experiences, or if they’re driven by outliers. Anomaly + Forecast are new features in Amplitude to combat this problem, so you can monitor growth with clarity, and set more-informed goals for your product.
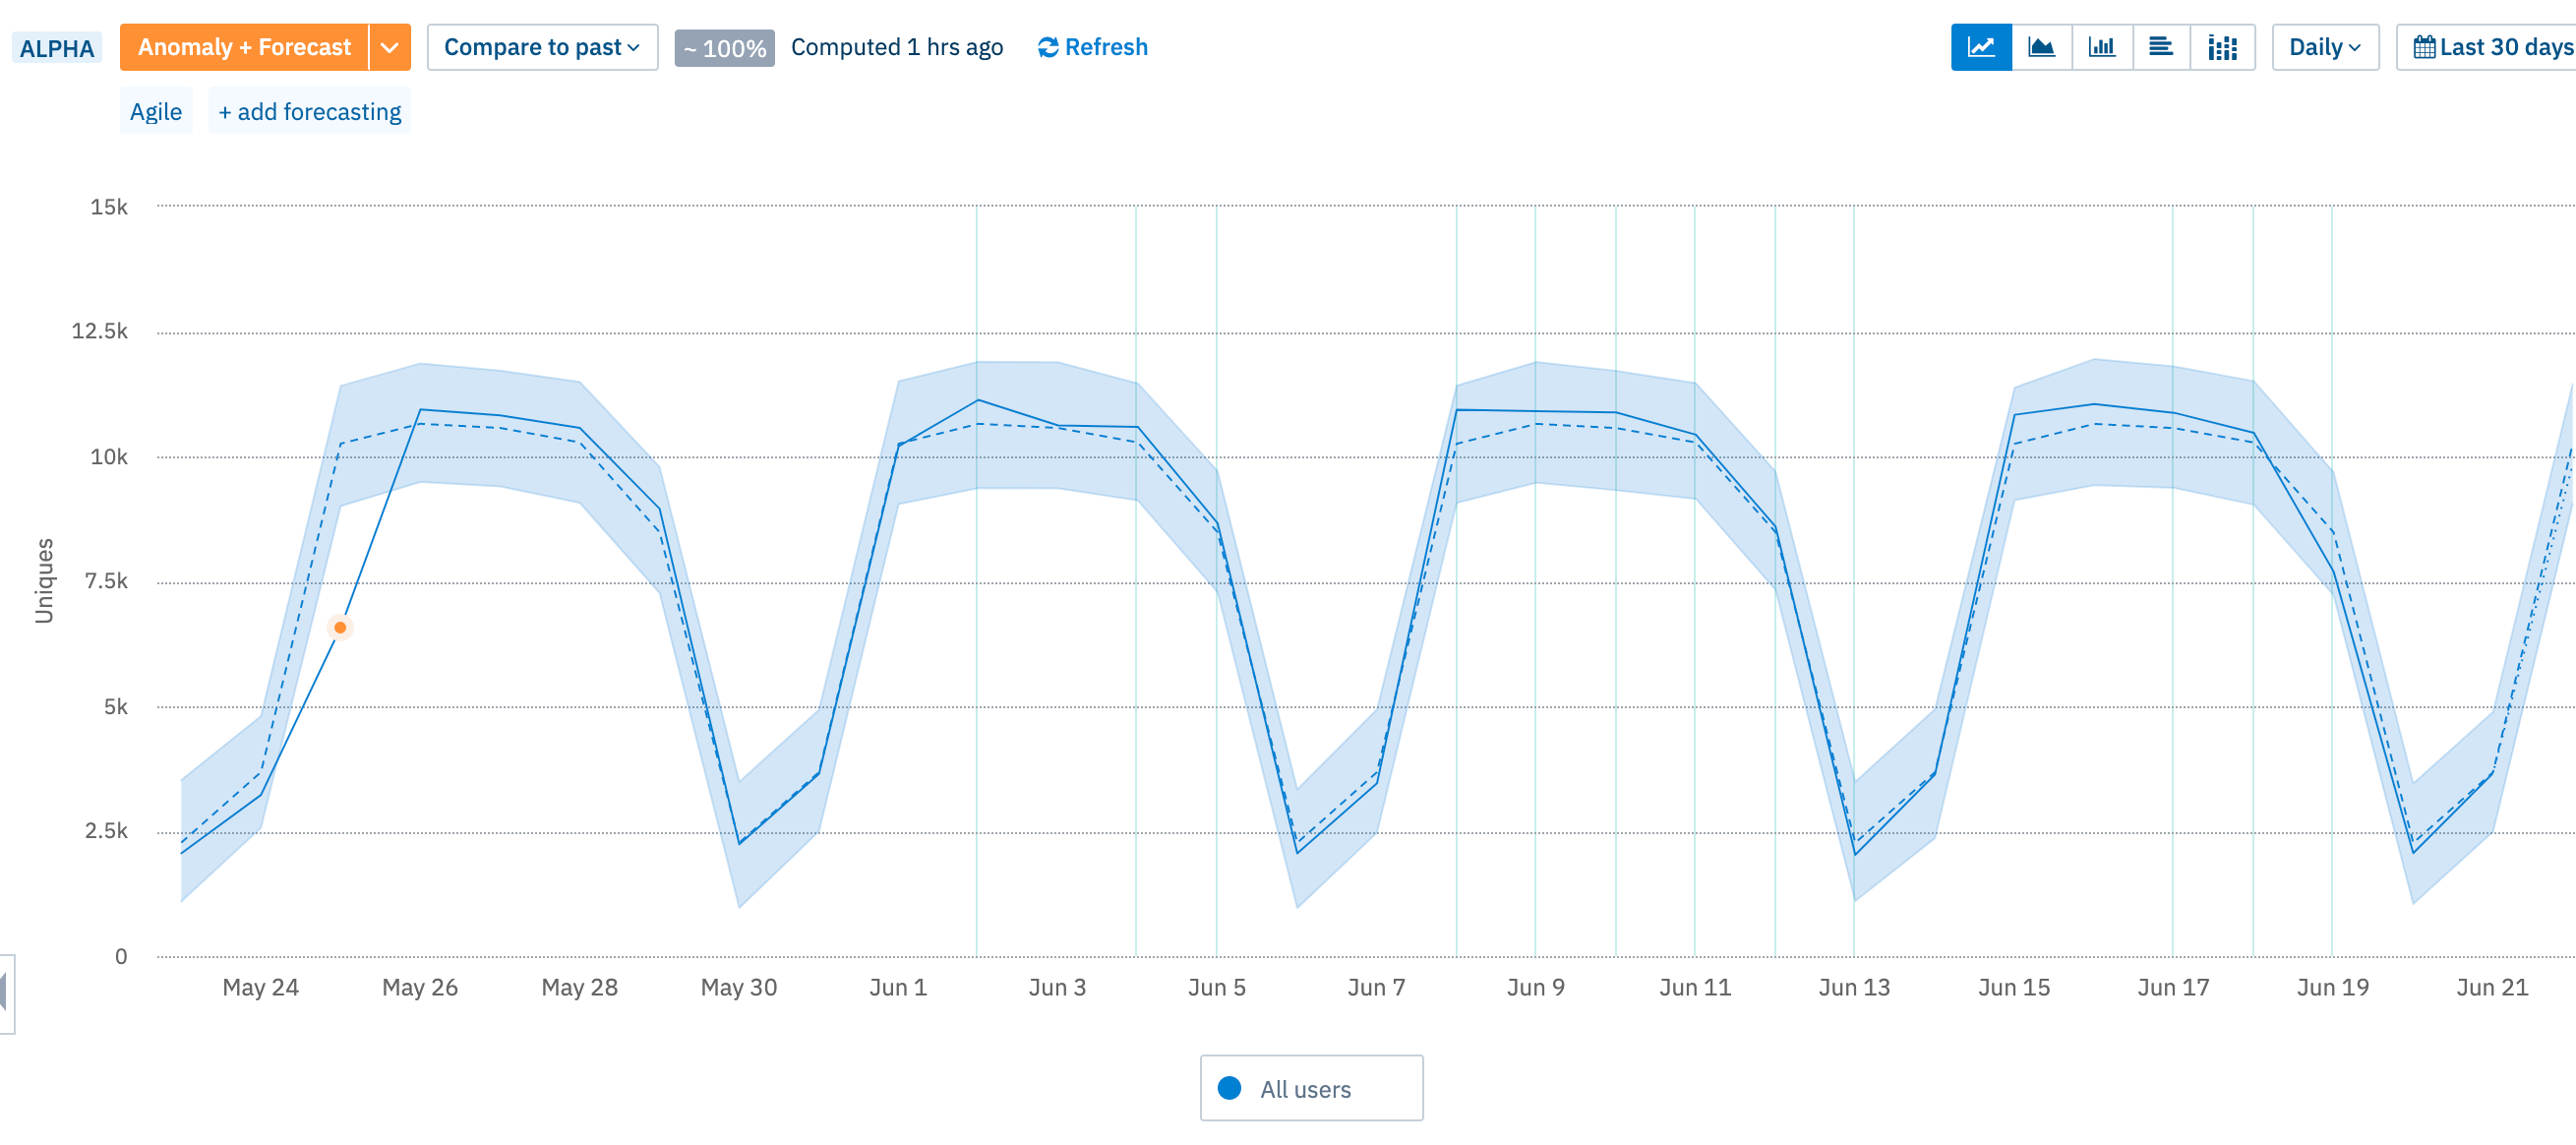
Anomaly Detection helps you uncover statistically significant changes on any time series chart with just one click, so you can understand the significance of changes as you discover them. Anomaly Detection comes with three mode settings: Agile, which is optimized for quick analysis on recent data; Robust, which analyzes a longer historical interval to account for seasonality; and Custom, which lets you designate a confidence interval and analysis period.
Forecast analyzes your historical data, and visualizes your expected future metrics so you can estimate trends, and use them to inform your goals. Check out the quick demo below, and see here for full instructions on the feature.


