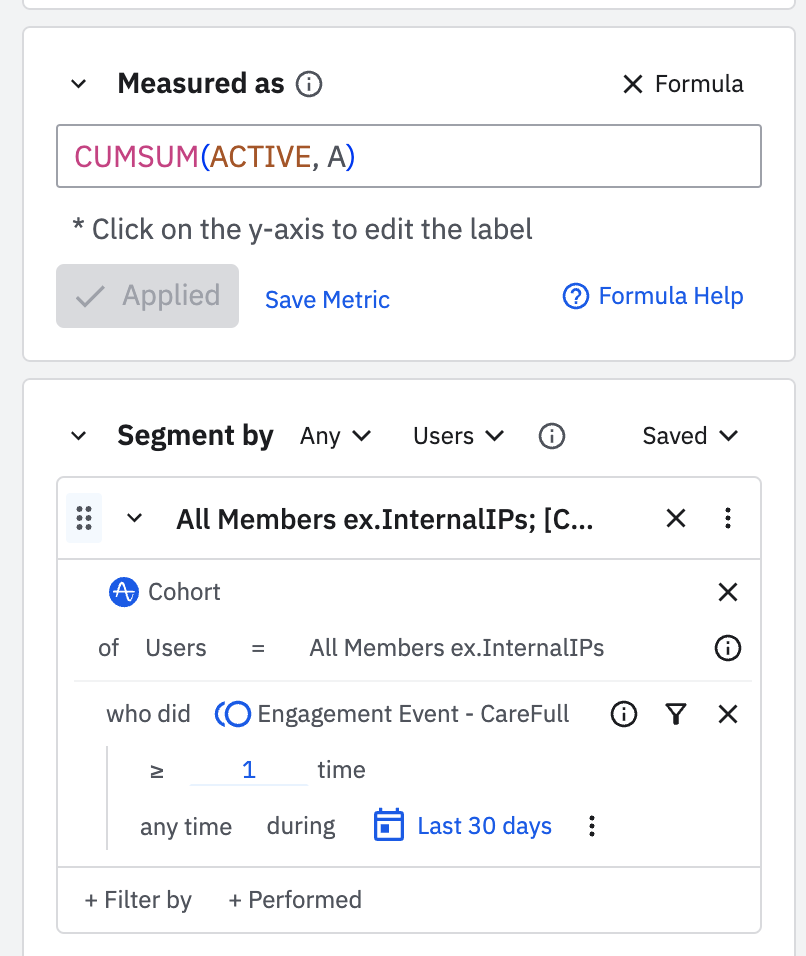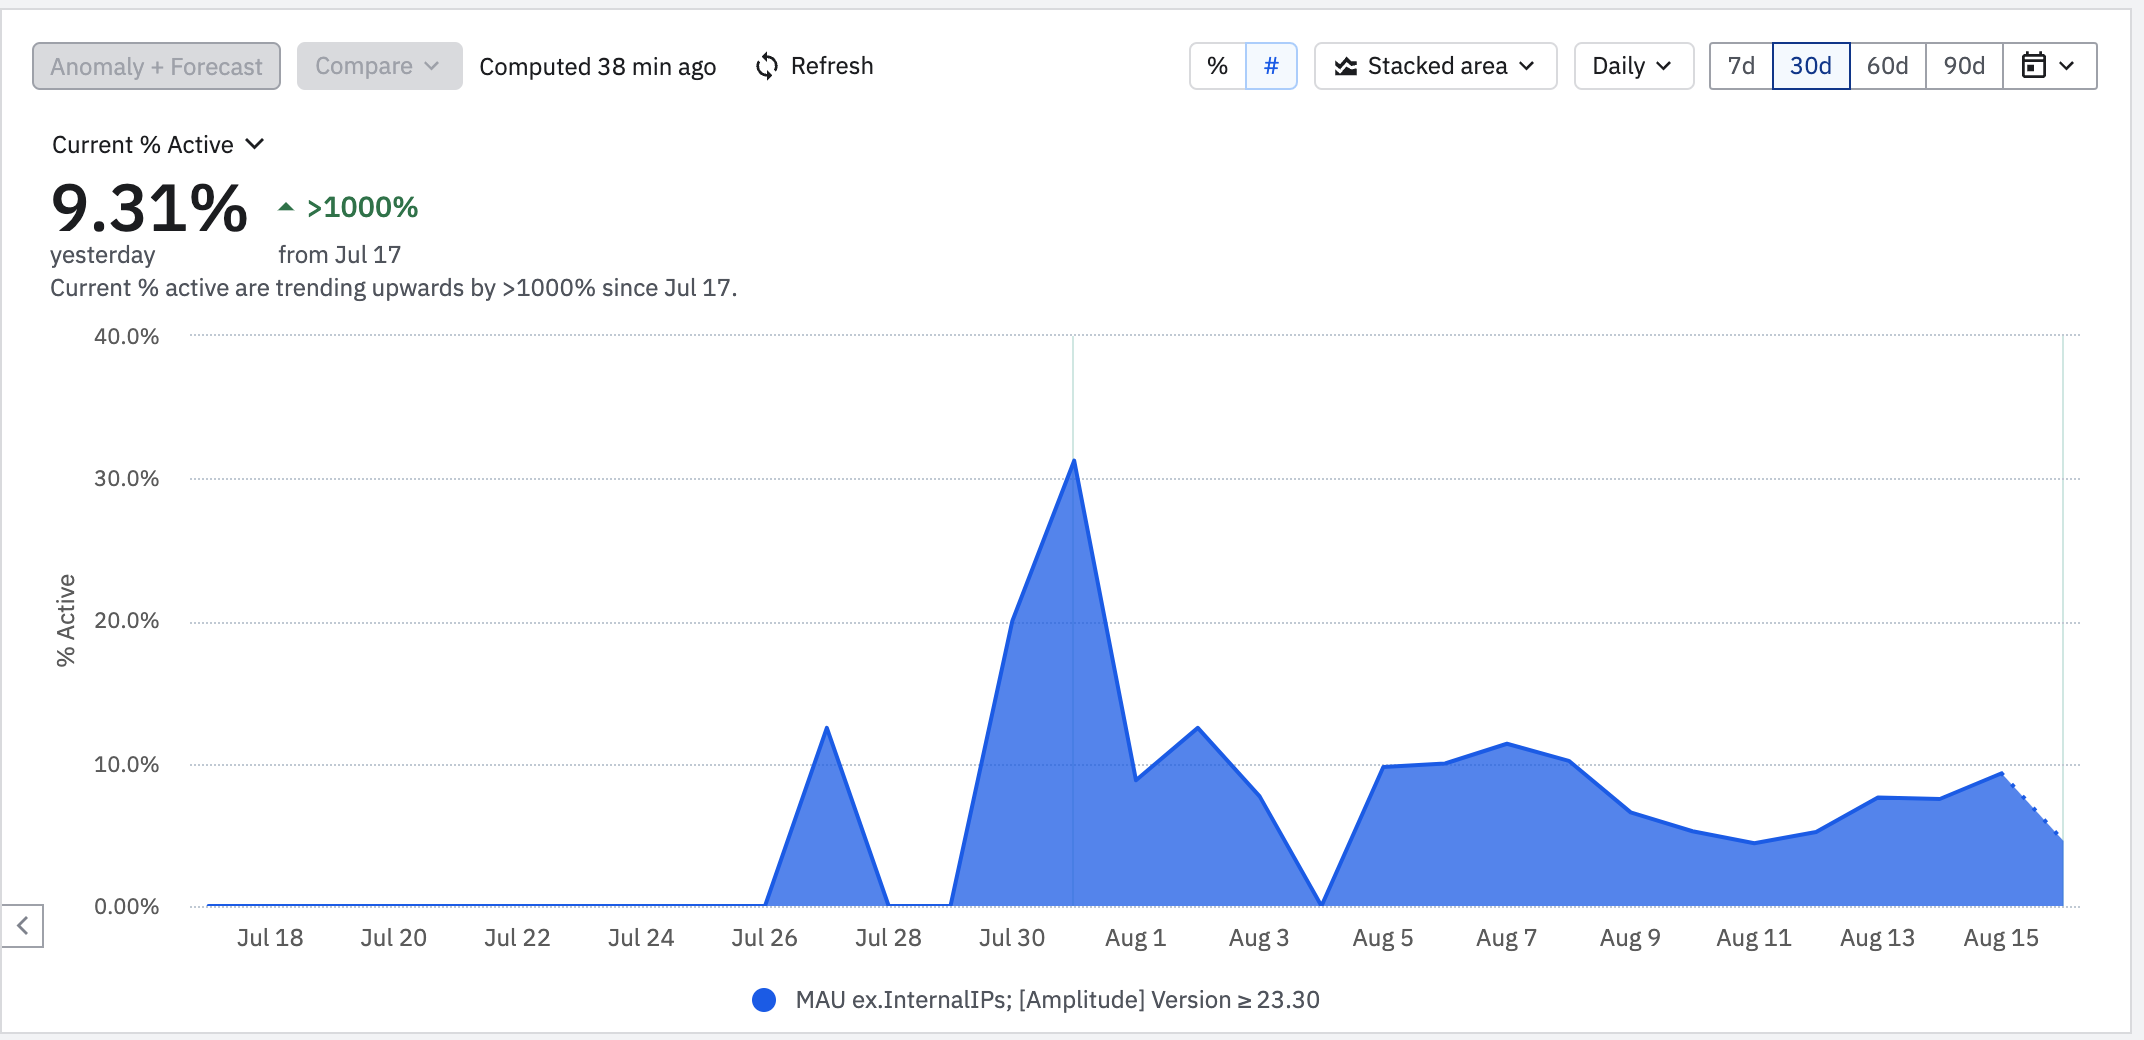
I’m using the segmentation chart and the % Active to see how frequently MAU are interacting with a new feature. I want to see this on a cumulative basis though, more like, what % of MAU have completed this event through X date. Not sure how to do this.
If I change the chart type from Stacked area to Bar chart, I think that shows the total cumulative % that have completed it (it’s just a single bar) but I would like to see how that changes over time.