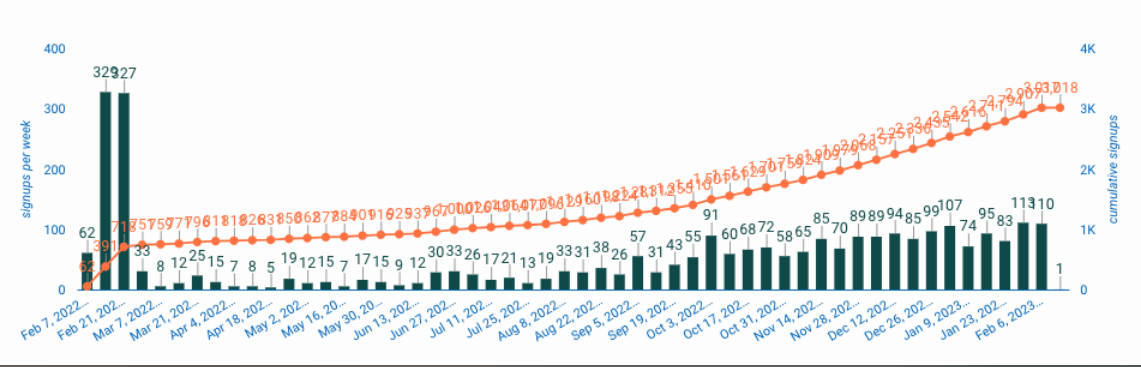
i want to create a graph of total signups (cumulative) and signups per day
Please see sample below

i want to create a graph of total signups (cumulative) and signups per day
Please see sample below
Hello Karla,
You can use the “formula” option in the segmentation chart and use a regular formula (such as “Totals” assigned to your signup event) with a second “CUMSUM” formula (assigned to “Totals(signup event)”) which will compute the cumulative sum of your total signups.
Here is an exemple I made with Amplitude demo: https://analytics.amplitude.com/demo/chart/new/ilmz8vx?source=copy+url
The only issue is that you can only use the “line chart” option to get a similar result to your graph, and both your daily/weekly/monthly/quarterly signups and cumulative signups will share the same axis scales.
Hope this helps! 
Thanks for jumping in here 
Thank you so much 


If you don't have an Amplitude account, you can create an Amplitude Starter account for free and enjoy direct access to the Community via SSO. Create an Amplitude account. You can also create a Guest account below!
If you don't have an Amplitude account, you can create an Amplitude Starter account for free and enjoy direct access to the Community via SSO. Create an Amplitude account. Want to sign up as a guest? Create a Community account.
Enter your E-mail address. We'll send you an e-mail with instructions to reset your password.