Hello!
I need to create a chart which will show how many users activated the subscription segmented by the traffic source they came from.
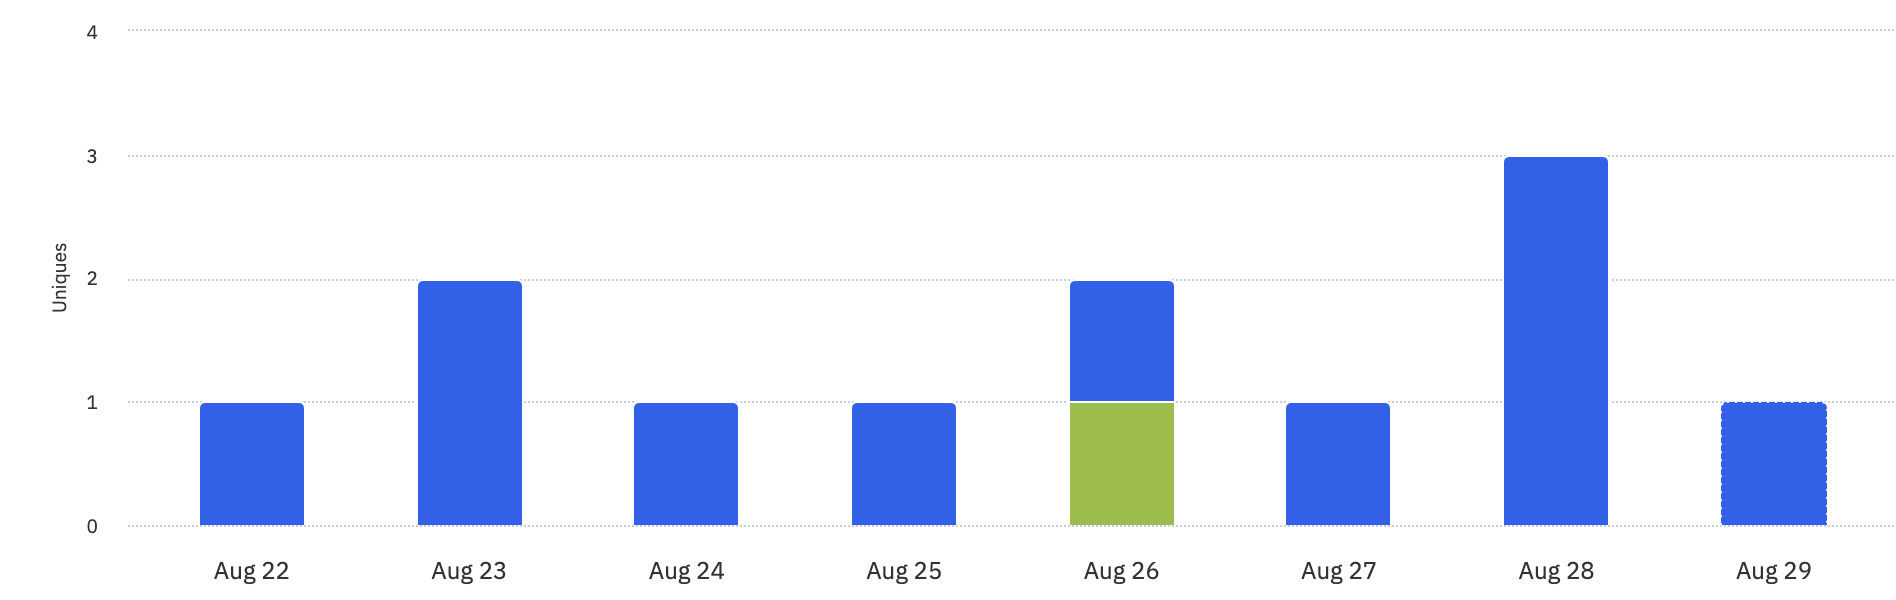
Here’s my subscription activation chart:
And here is my traffic source segmentation chart:
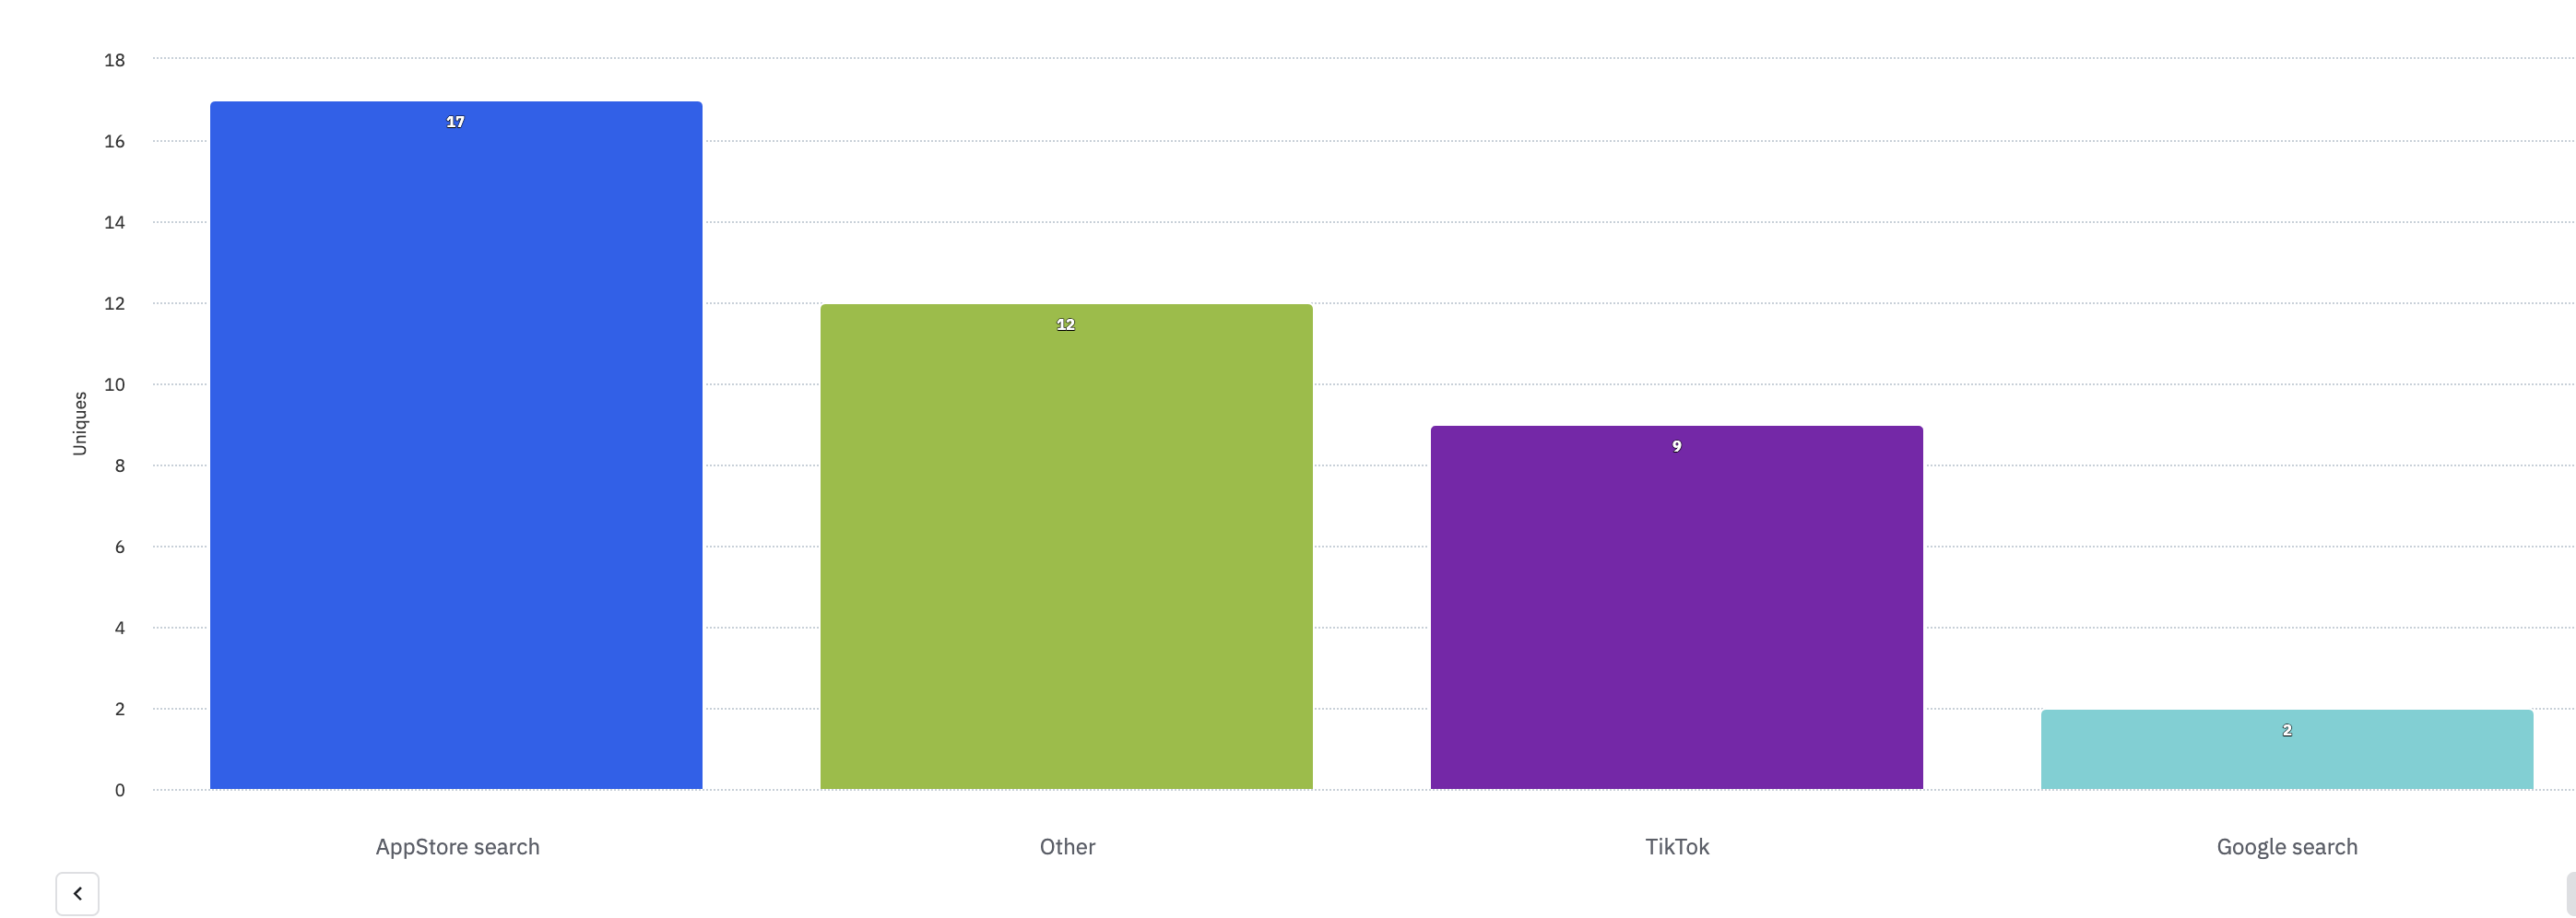
How do I know i.e. how many users who came from TikTok activated the subscription?
Thank you so much!