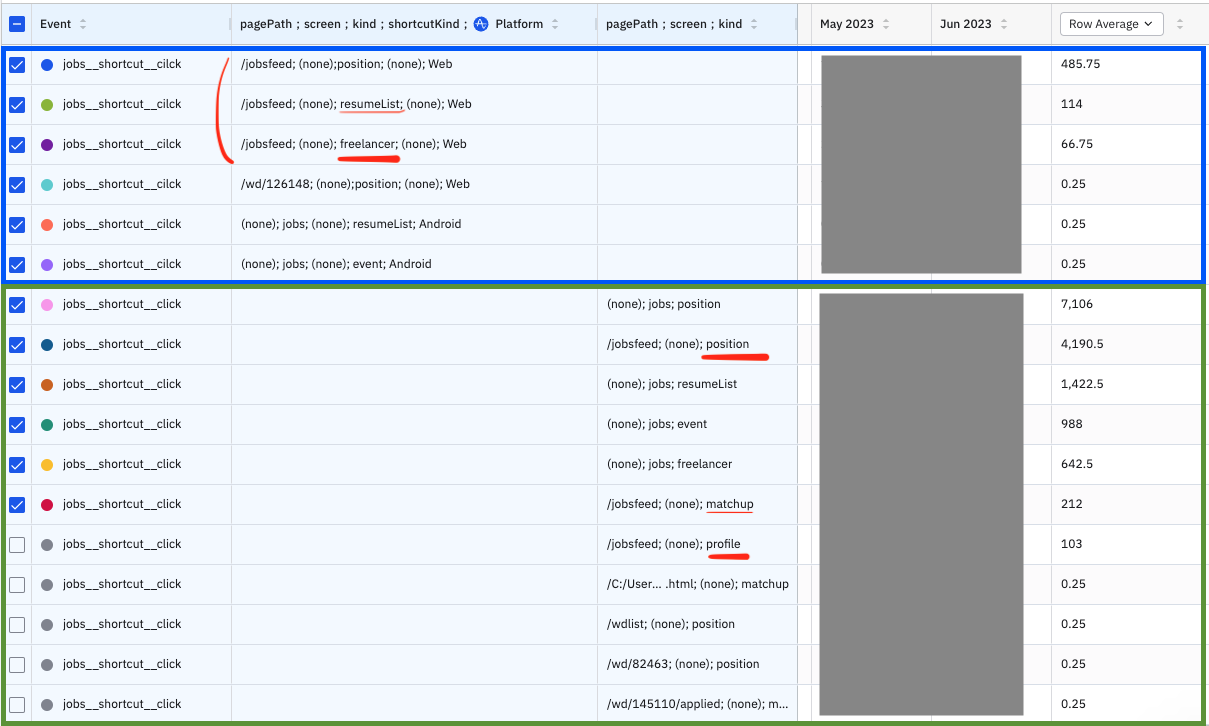
Hi @Jayeon Choi from your screenshot of the data outputs, it looks like you might have queried the event jobs__shortcut__click
two times in your event segmentation chart and each unique instance has a different set of group by conditions, which results in the 2 different columns of group by conditions
-
the first instance jobs__shortcut__click
is grouped by “pagePath”, “screen”, “kind”, “shortcutKind”, and “Platform”
-
the second instance jobs__shortcut__click
is only grouped on by the first 3 properties “pagePath”, “screen”, and “kind”
That is why the same event name is being displayed separately in the list. If you remove one of the events from your original query, it’ll only result in one column of group by conditions.
What are you looking to display in this chart? You can divide the event based on strict property conditions such as
- only display
jobs__shortcut__click
where “kind” = resumeList - and separately only display
jobs__shortcut__click
where “kind” = profile
As you start to add multiple group by conditions to your event, it might be easier to read the chart in the format of a horizontal bar chart visual, or in a data tables chart type.