Solved

Converting an Event's Property's Value in a Segmentation Graph

  • 6 October 2022
  • 2 replies
  • 83 views

Badge

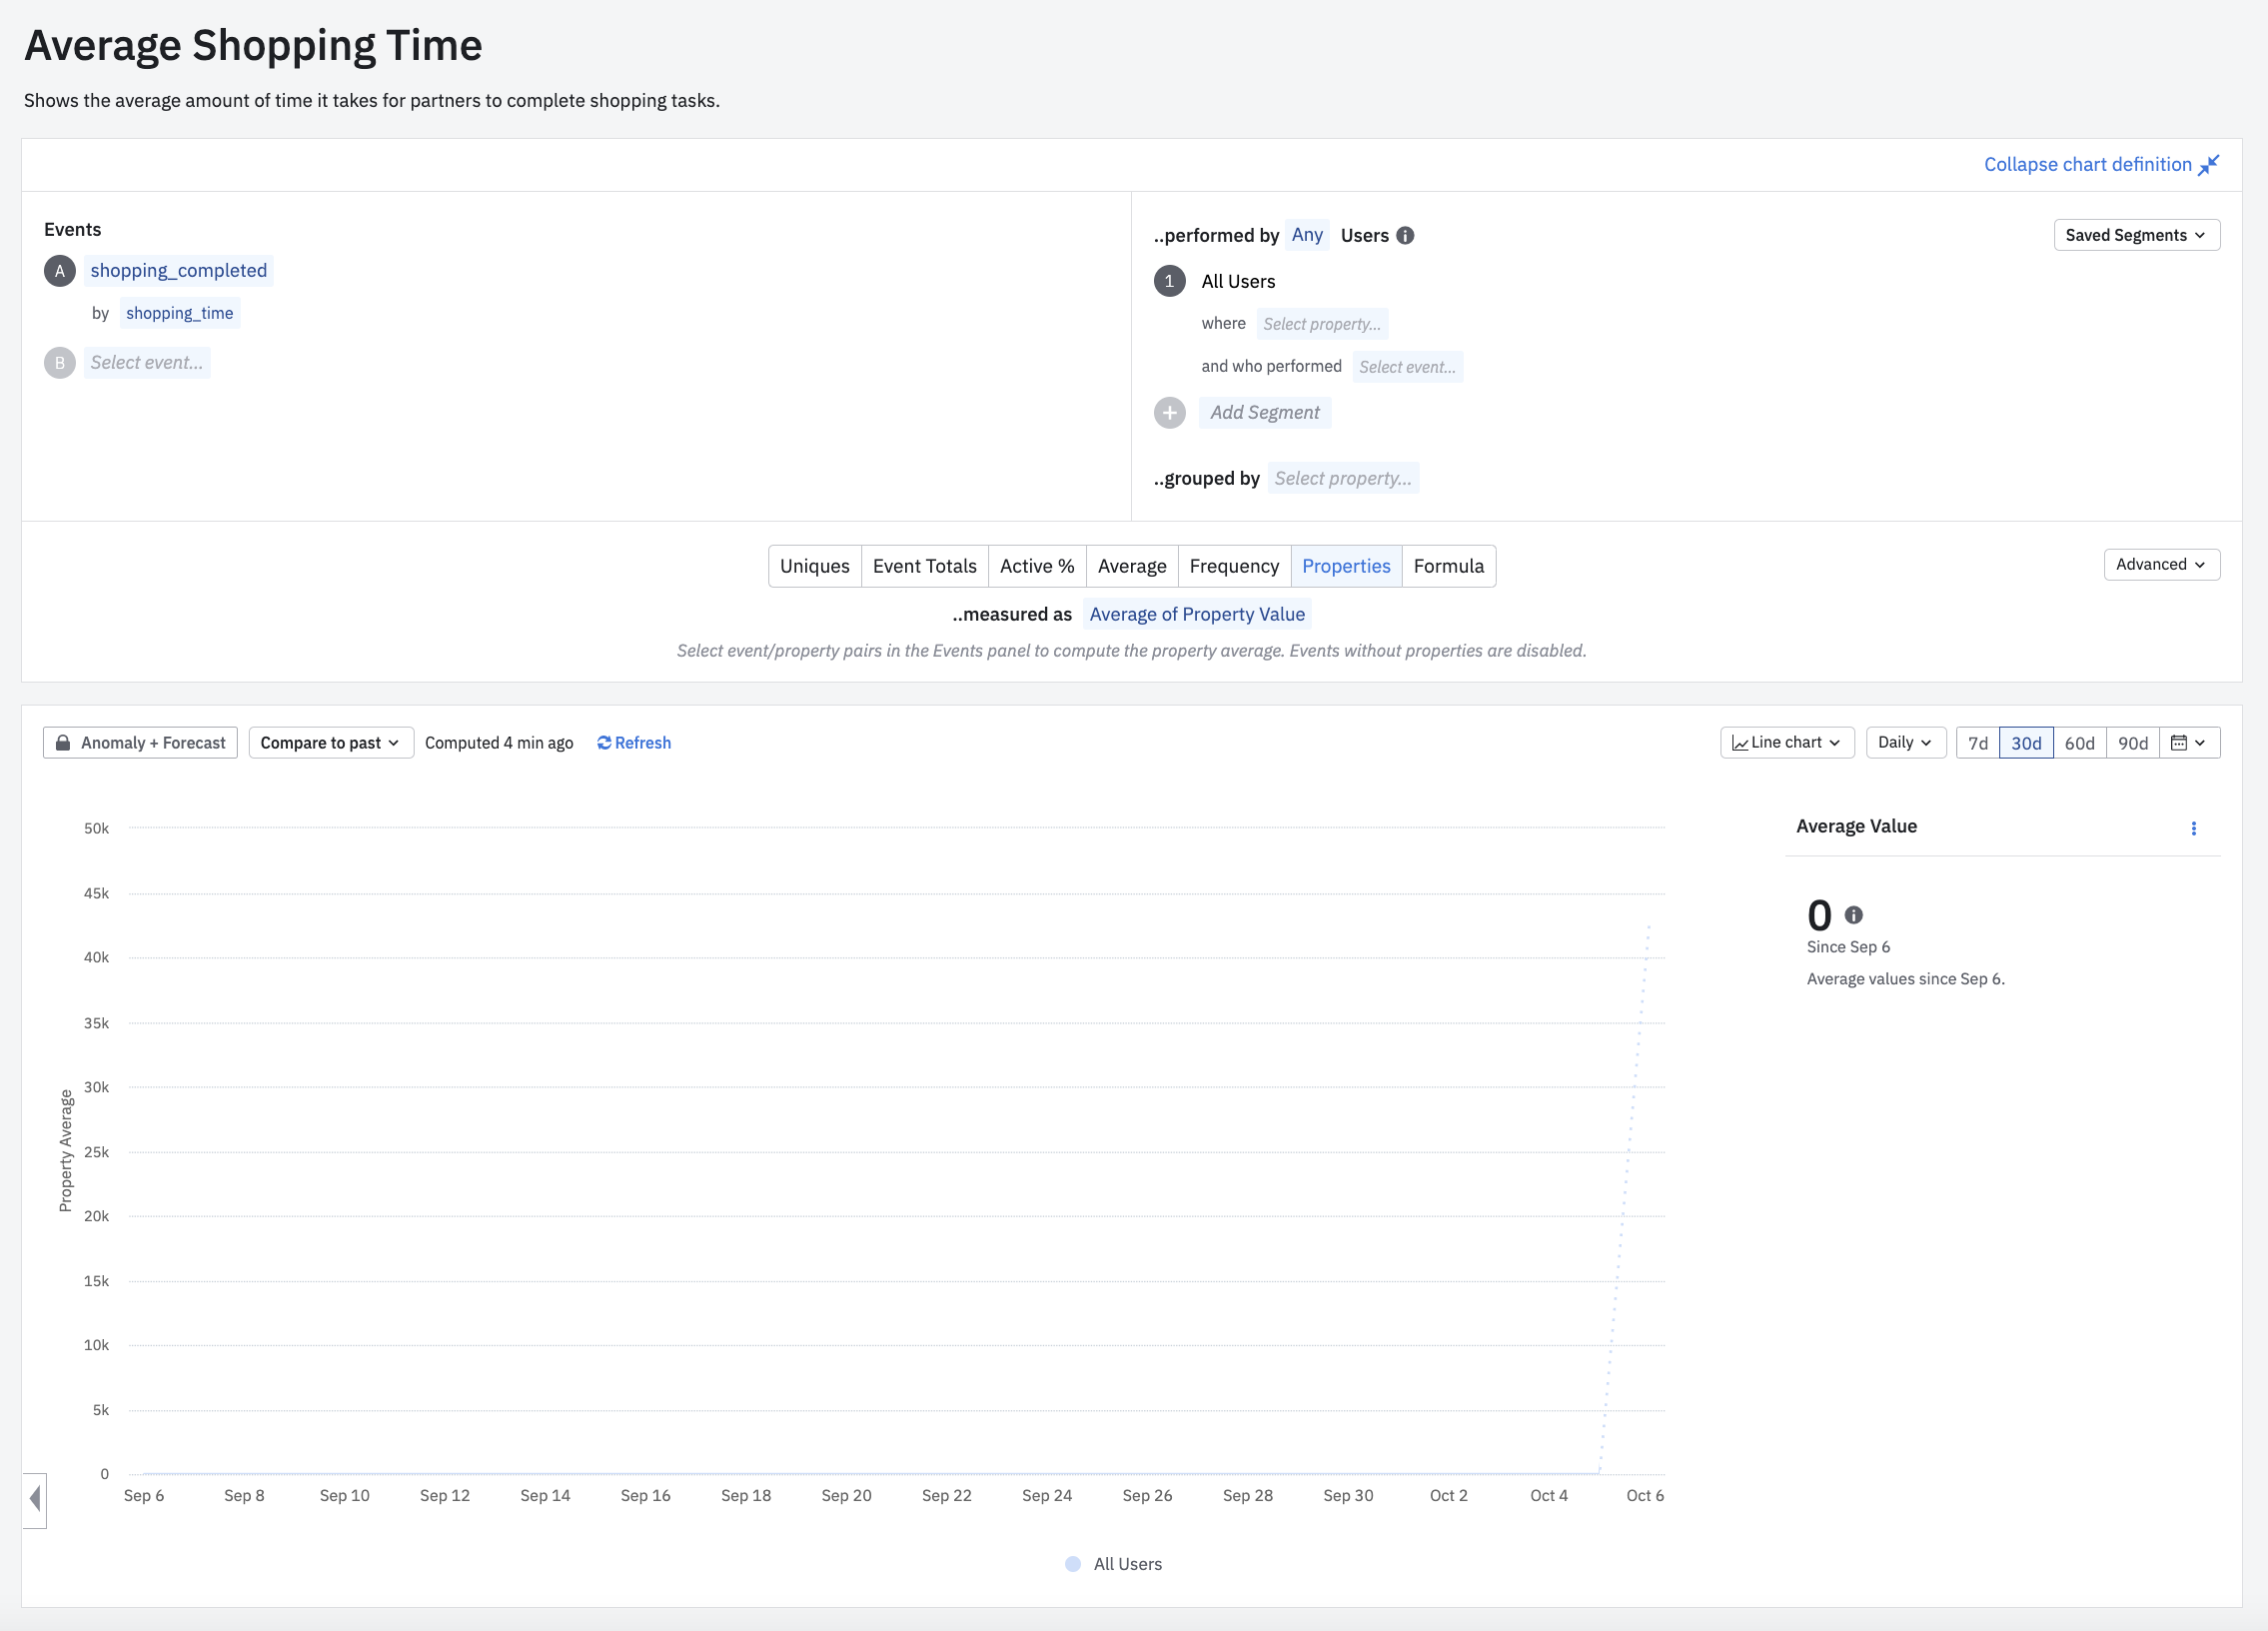
I’ve created a Segmentation graph that shows average shopping times. It takes a look at the shopping_time property of all shopping_completed events in a given day and plots the average of those values. I’m wondering if there is a way to apply a formula to the shopping_time values, which we are currently sending in milliseconds, so that we can show either seconds or minutes on the y-axis instead of what is currently milliseconds. Is this a possibility or do we just have to send the shopping_time values in whatever unit we are currently wanting to measure?


icon

Best answer by Saish Redkar 6 October 2022, 22:59

View original

2 replies

Userlevel 7
Badge +10

Hey @michaelhandkins 

Two approaches might work in your case if you stick to sending the shopping_time value in milliseconds -

  • Use the derived property feature to create a property value in mins/sec and use it in your chart. This derived property will be computed on the fly and can be used in any chart [ part of the Govern Add-On ]
  • Use custom formula PROPAVG and convert each datapoint in aggregate into either seconds or minutes by arithmetic calculations. As seen in this chart - https://analytics.amplitude.com/demo/chart/new/bhx8kyu. This approach limited to custom formulas.

Let me know if I have interpreted your use case correctly. Hope this helps.

Badge

@Saish Redkar Awesome, these are perfect! Thanks!

Reply