We wanted to track revenue events, but wanted to make sure those revenue events wouldn't be tracked as active events as that would mess up our retention data. I was pretty confident this could be done by marking a revenue event as inactive. As I did here:
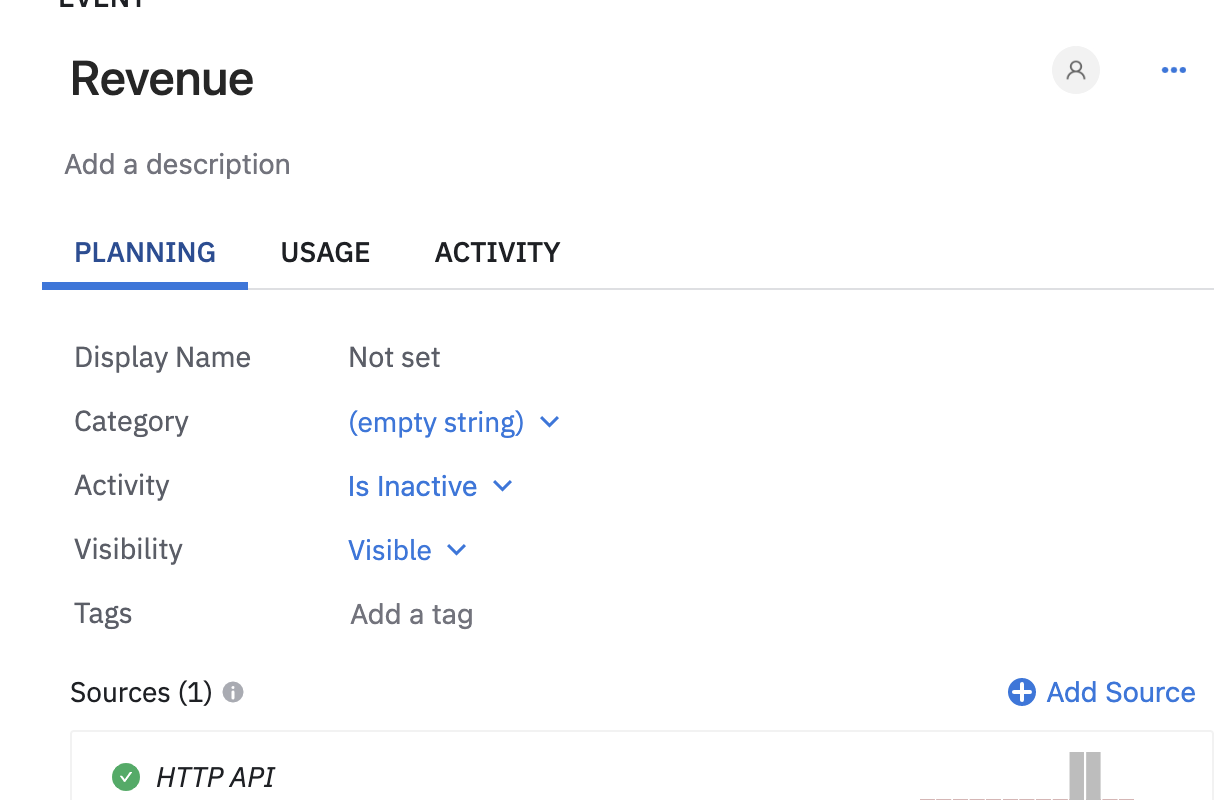
 

However if I create a segmentation graph that is tracking “Any Active Event”, users who have only had this revenue event will show up in the graph.


Here you can see me setting up a Segmentation graph with the events set to “Any Active Event”
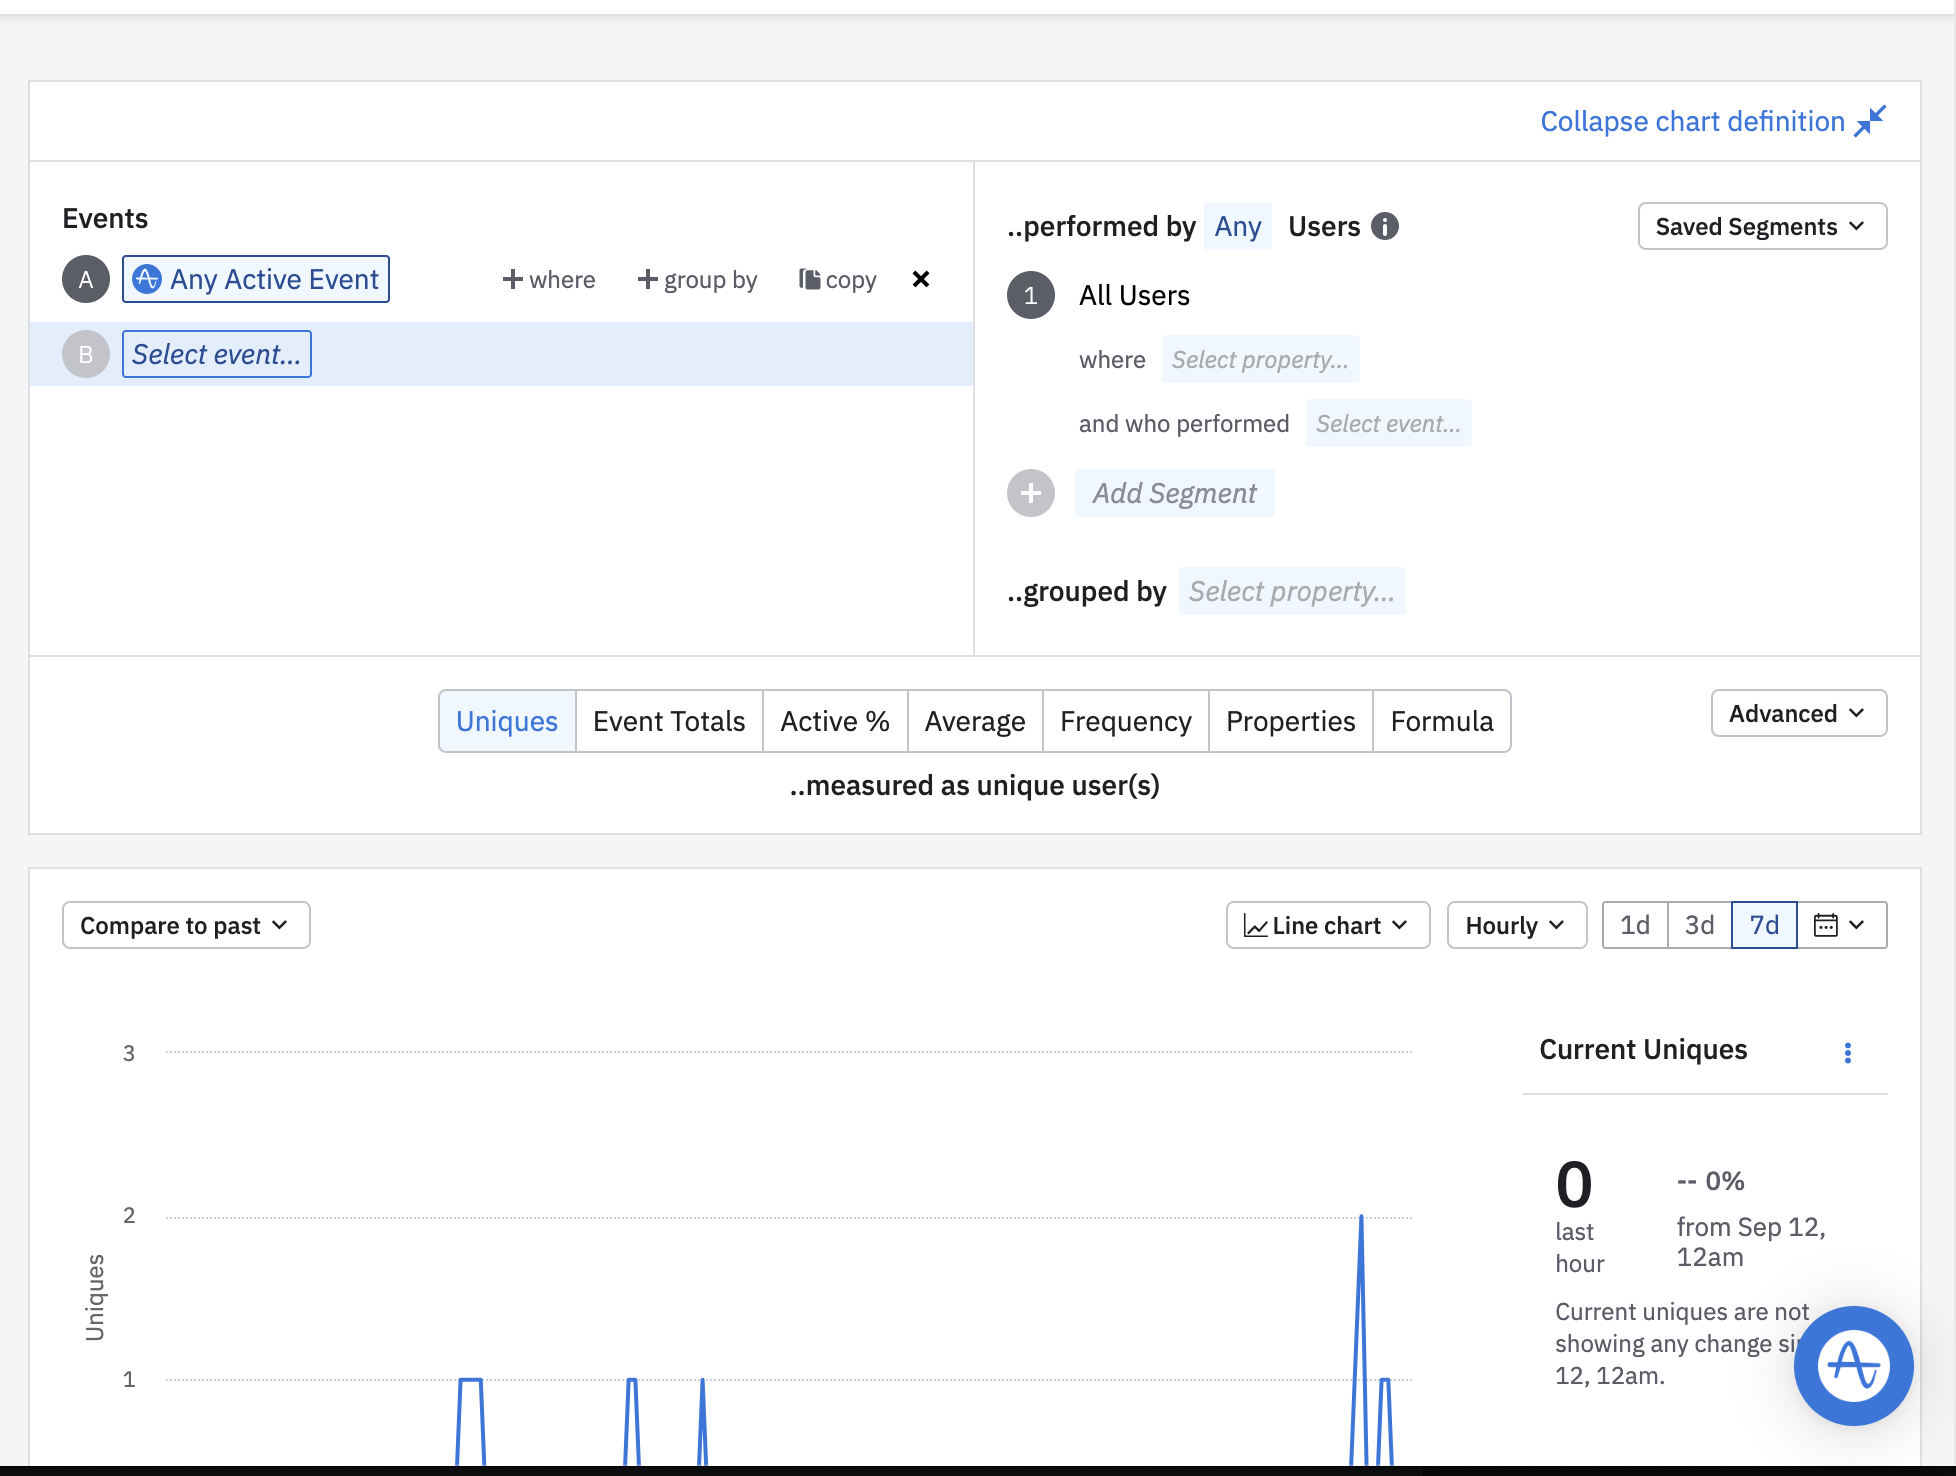
 

If I pull up the User Stream for the last blip in the graph like so:
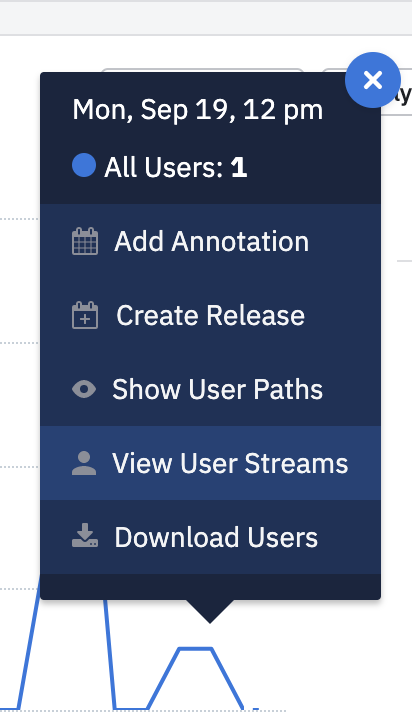
User 88 appears, even though they have only had a “Revenue” Event in the past 7 days.
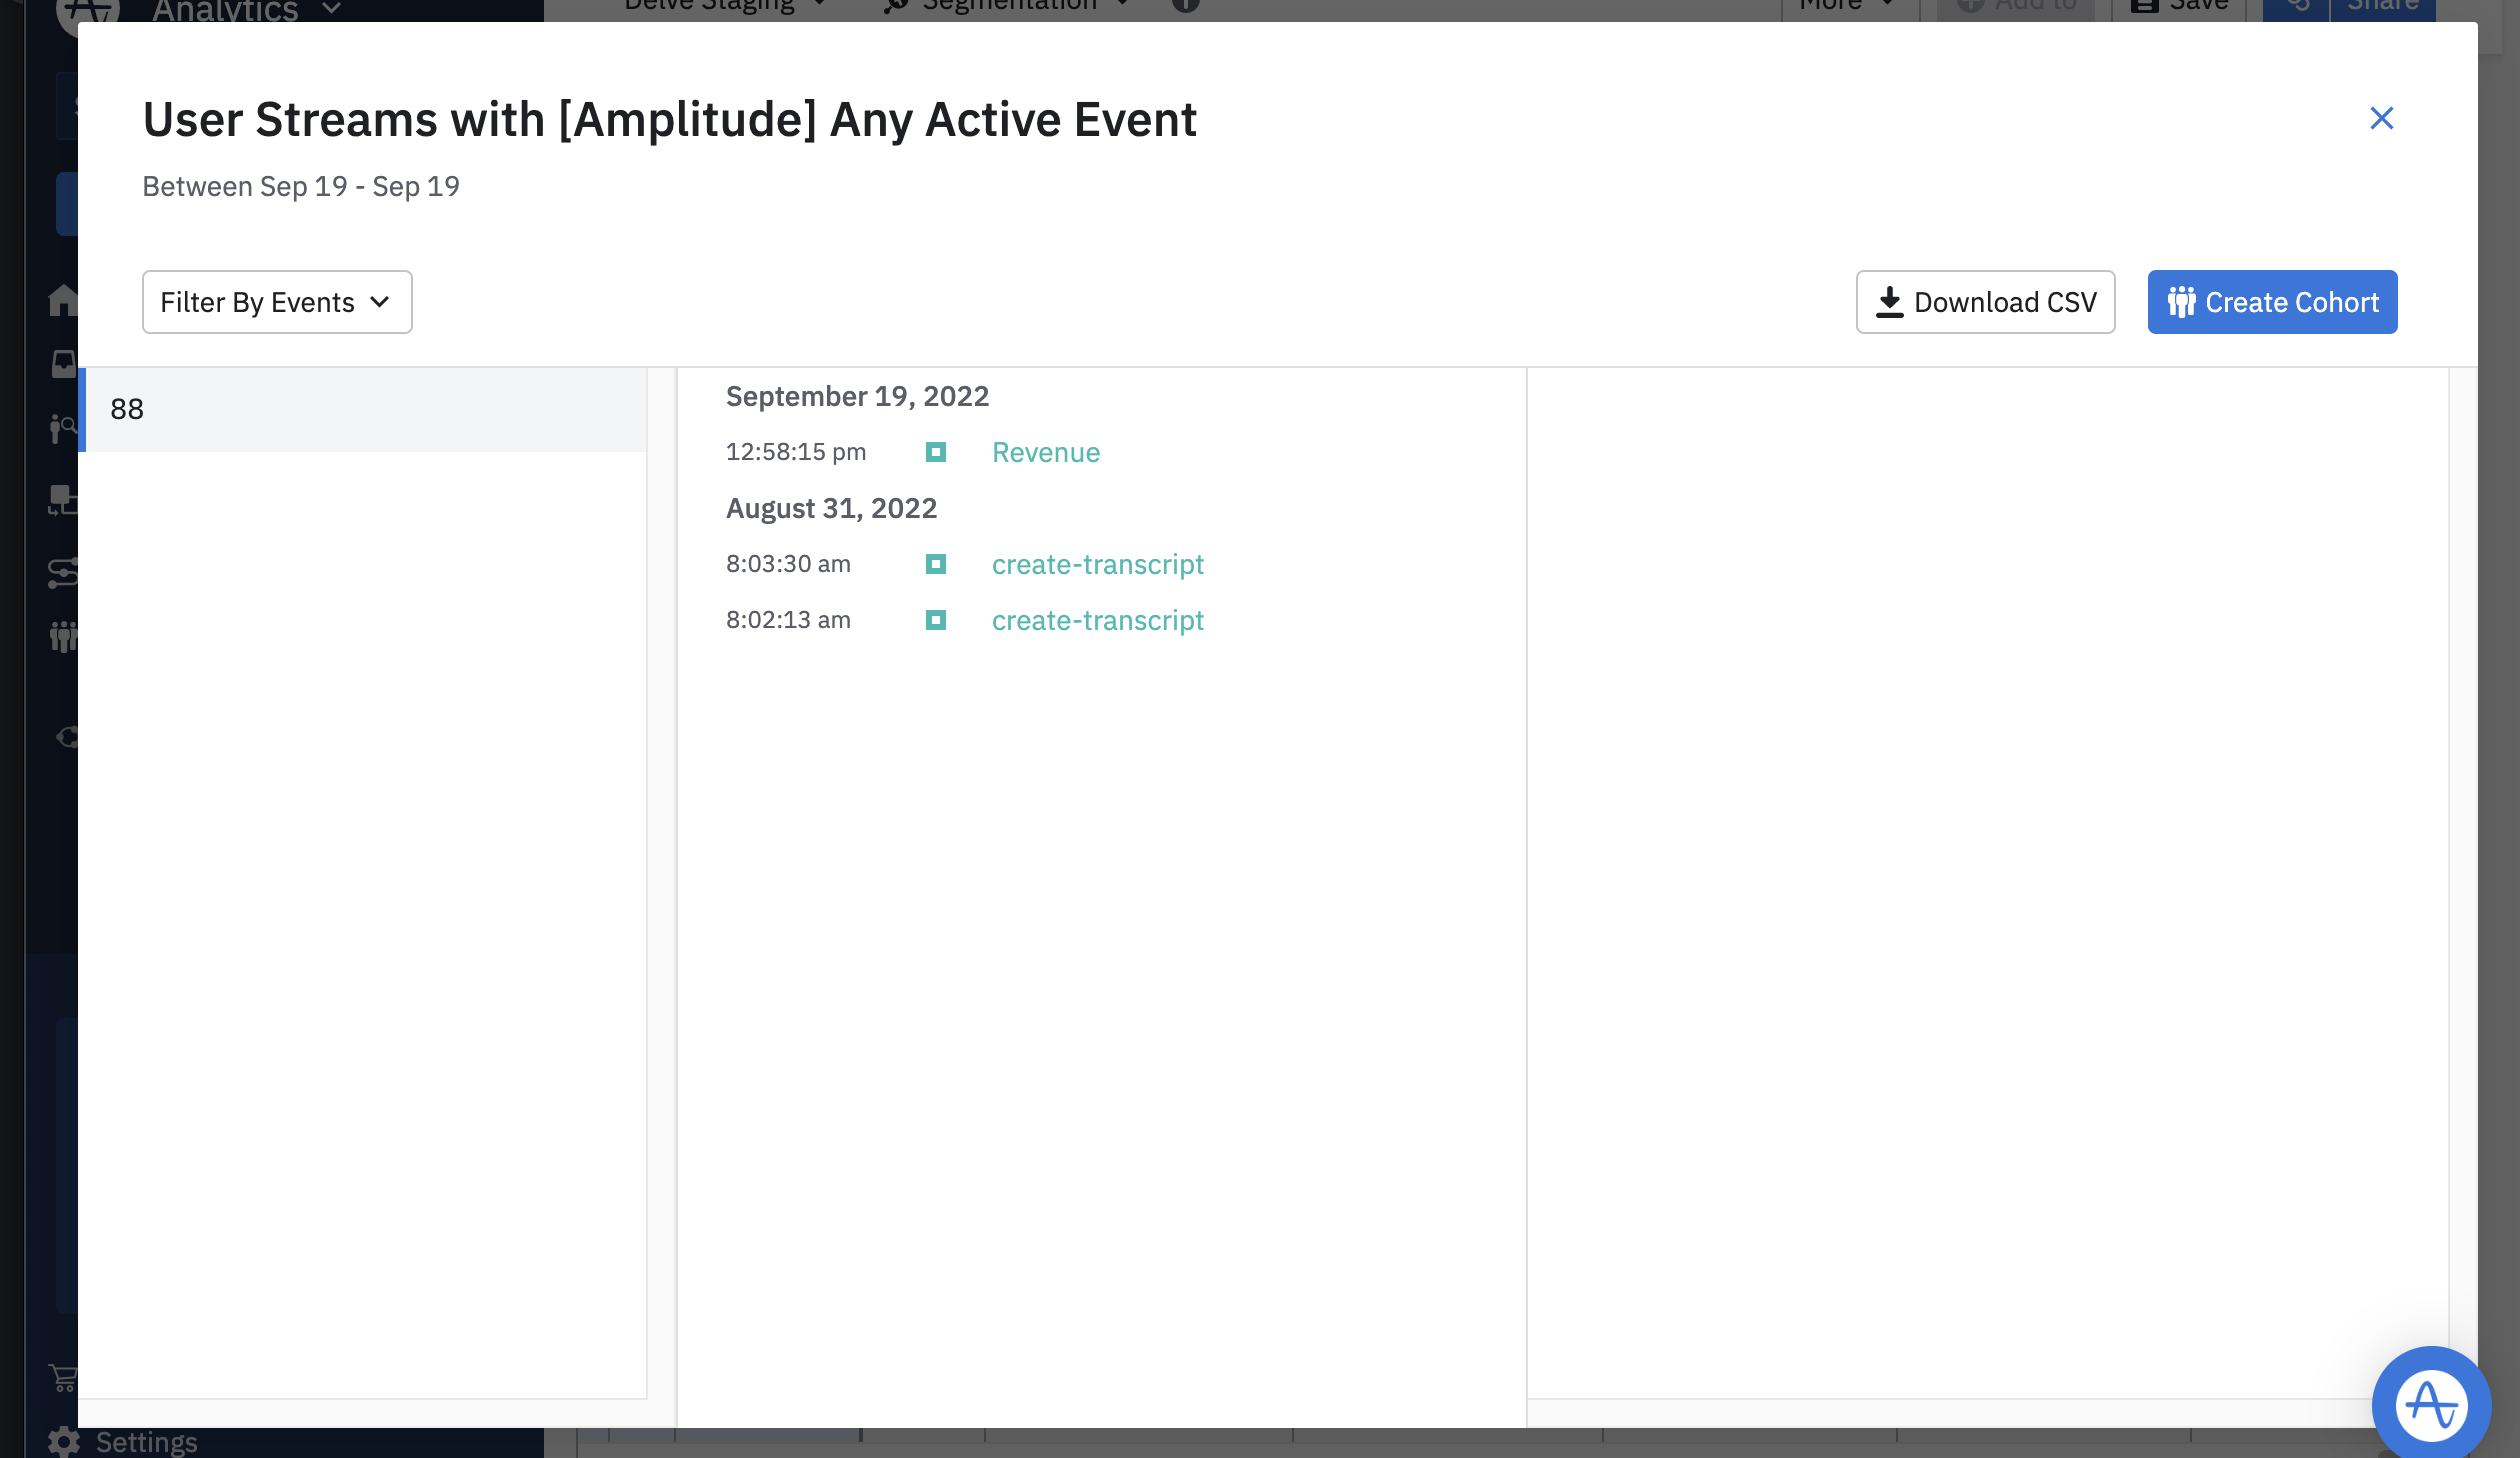
 

But they have still shown up in the “User Stream” pop up and counted against the total.

Similarly the same user is displayed here in the User Paths, which shows that their only event was “Revenue”, which again is an inactive event:
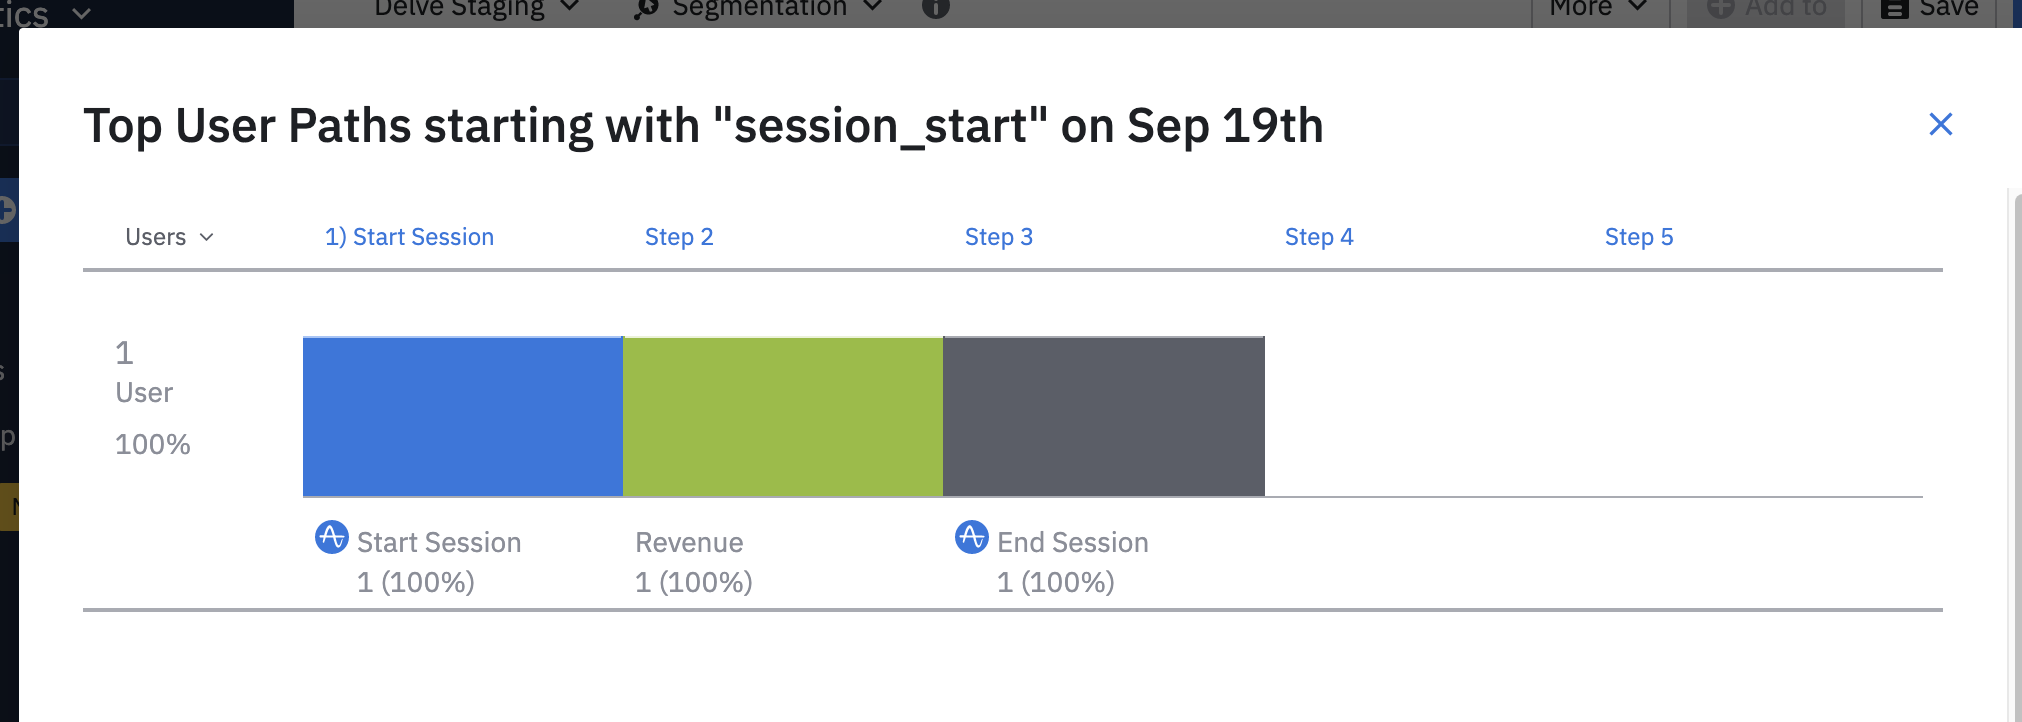


My only theory is that maybe this “Start Session” is somehow causing this user to be “Active”. But the Revenue session id is set to -1 (which should make it out of session).
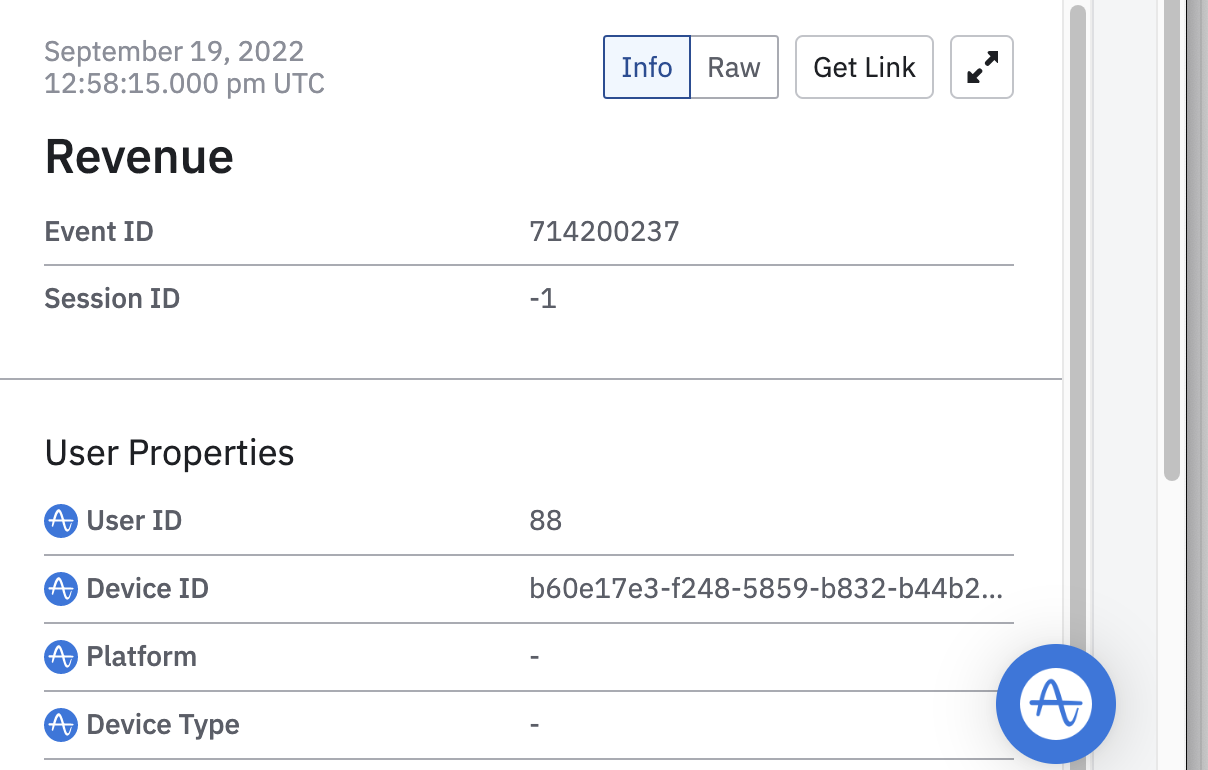
 

I am unsure why this inactive event is causing the user to show up in a graph filtering for “Any Active Event”. Any help with this would be helpful, because I don’t want to be dirtying our retention data with events that are not triggered by the user using the website.


Here is another example. I put “Any Active Event” and “Revenue” for the Events to track into the graph.

I would expect any hour where the only event is “Revenue” to have 0 Active Events. Instead, Any Active Events is equal to the number of Revenue events, which means that Revenue is being counted as an “Active Event”.

(The exception is 8am where there were 2 events that were non-revenue events, which makes “Active Event” be greater than “Revenue” events).

It seems to me that Revenue, which is marked as an inactive event, is definitely being counted in the “Any Active Event” count.


Similarly, if I switch the graph to “performed by Active Users”, I thought maybe the Revenue events would go away (at least in the hours where Revenue is the only event that is performed). However the graph remains exactly the same.


Here may be an even cleaner example to display my confusion, I created a graph comparing active events and all events. The graph shows that the event counts are the same, so that means the only events are active events.


However, if I click on “user path” for the most recent hour that had activity:


I can see that the only event is “Revenue”, which has been marked as “inactive”.


I found another way to show the issue I’ve been running into. I created a graph that compares “Any Active Event” vs “Any Active Event - Revenue”. Since Revenue is not an active event, you would expect these two to be exactly the same. However they are different, Any Active Event is counting users who only had “Revenue”:


Hi @alimpaecher,

Thank you for the detailed explanation! Please allow me to check with the engineering team and get back to you!

Best,


Hi @alimpaecher

After checking your project Data, we noticed that you didn’t publish the changes after making them in Data. Event will be treated as inactive by analytics events processor only after changes are published in Data.

Hope this helps!


Thanks @Yuanyuan Zhang this was the issue. The fact that the changes needed to be “published” was not something I was aware of. It didn’t match my mental model of how saving things worked. Perhaps there could have been something stating that the changes I made to that data event were unpublished (I know it was in the left hand menu, but didn’t know to look there) But will make sure to look out for it in the future!


@alimpaecher 

You are very welcome! I understand that it can be confusing. This logic is to prevent accidental editing, but we can certainly improve on the UI. Please kindly refer to this doc for working with branches, perhaps it’s helpful for future cases, too! 

Best, 


Reply