Solved

User Composition measured by most recent value is wrong

  • 13 March 2023
  • 5 replies
  • 126 views

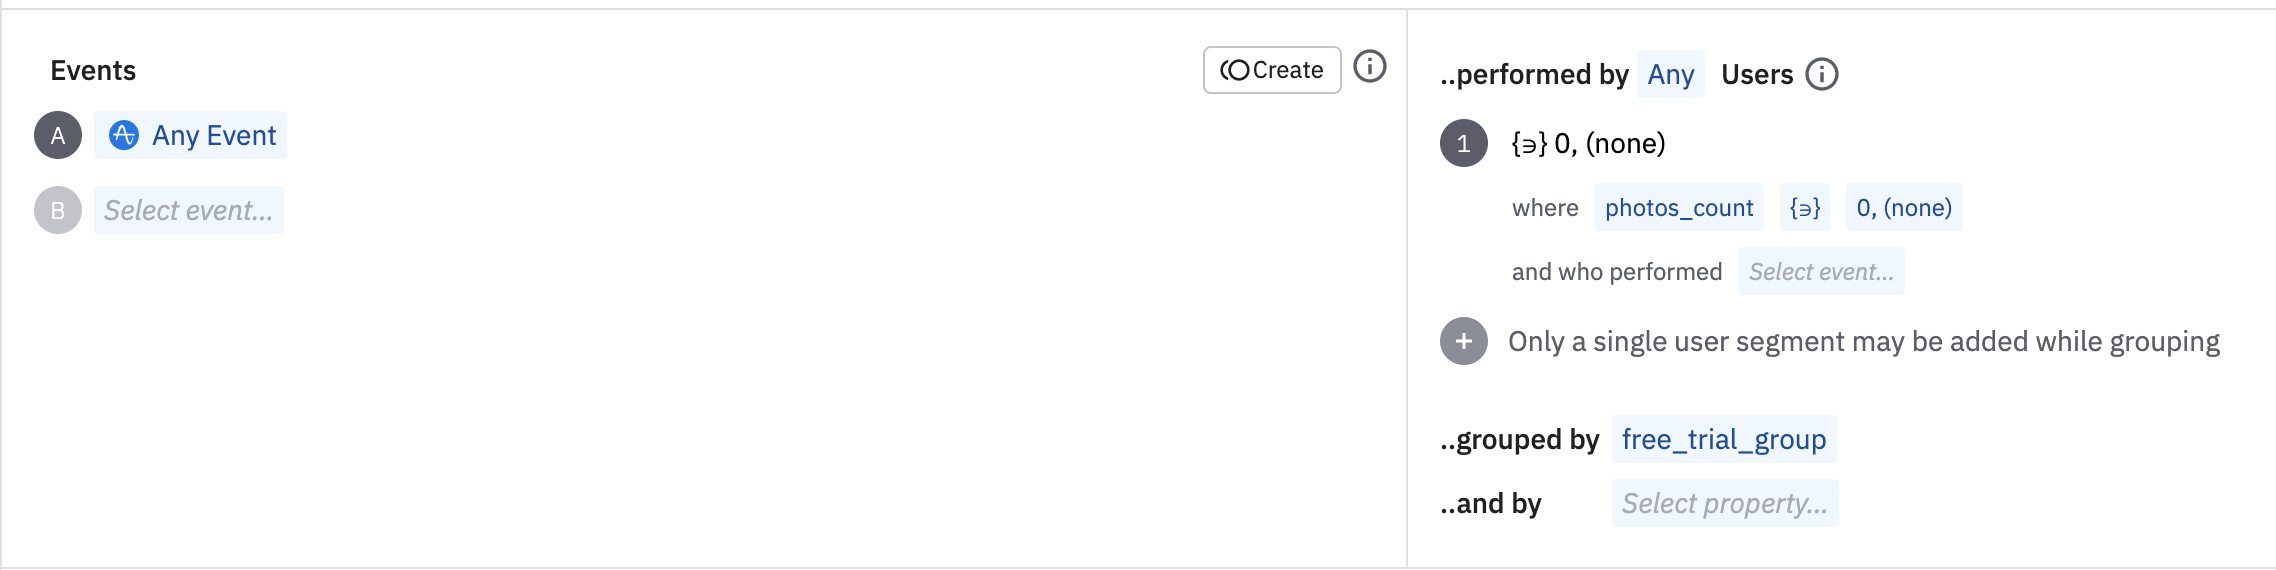
I have a user property called free_trial_group which has 3 possible values (7_days, 30_days and none) and I used it for compositioning:
 

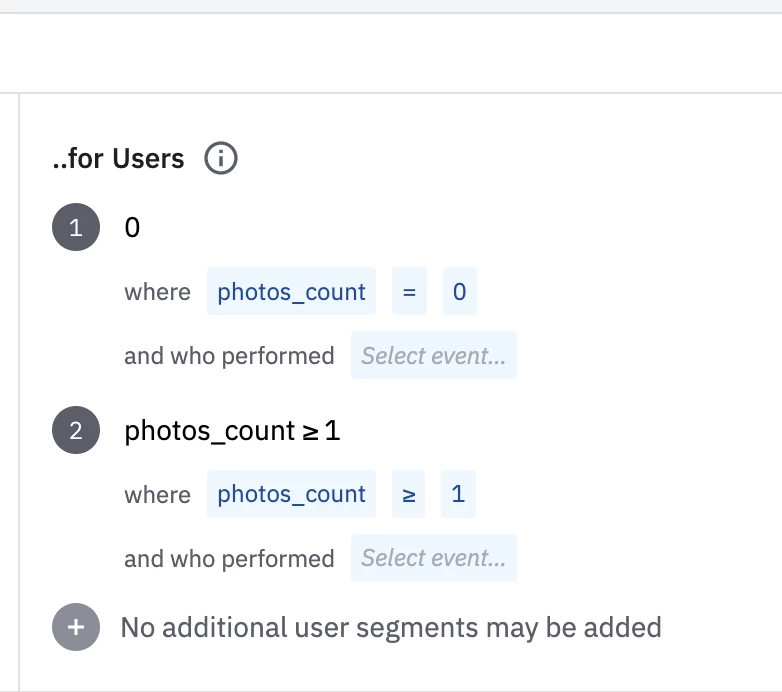
Also I have photos_count user property which I used for segments:


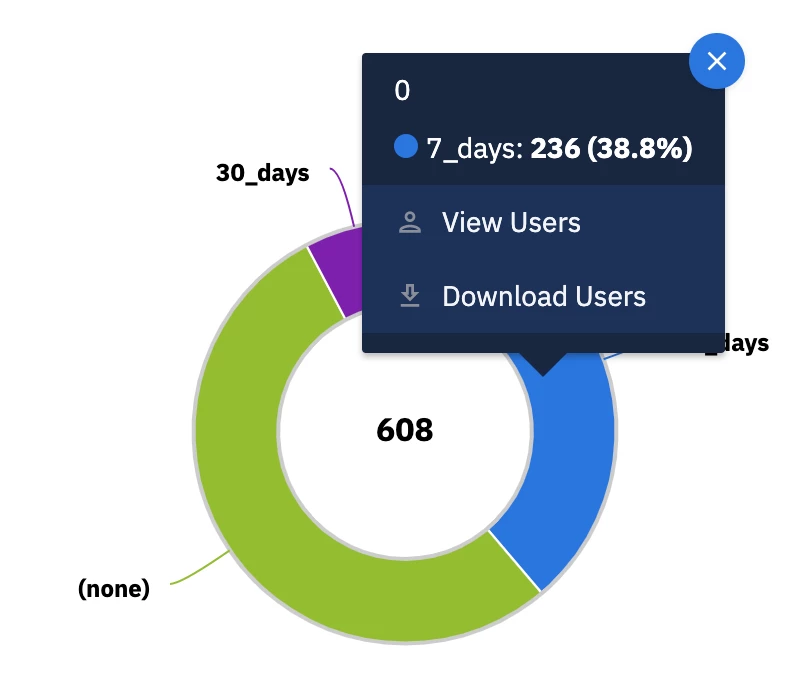
The problem is that values in the resulting pie chart and downloaded users of one of the segments don’t match even though I use most recent value.

For example

I’m downloading those users who have 0 photos_count and are in 7_days free_trial_group:


It’s the photos_count column:
 

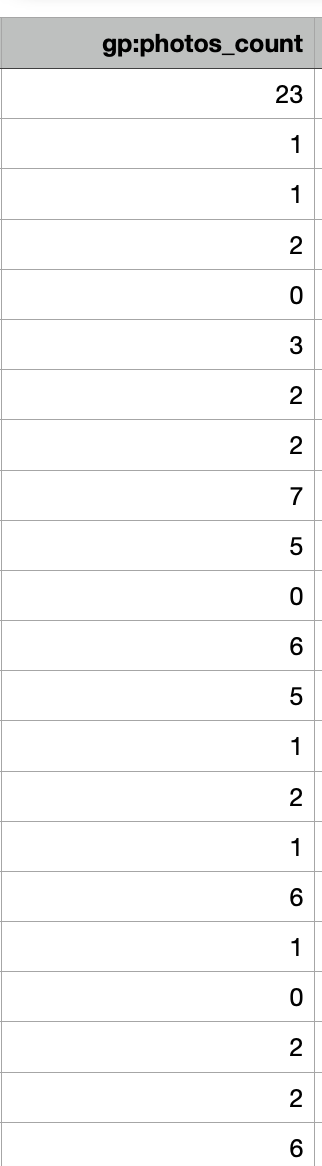
As you see, almost none of the really has 0 photos_count.

Why? Am I doing smth wrong?

icon

Best answer by Saish Redkar 14 March 2023, 05:49

View original

5 replies

Userlevel 7
Badge +10

Hi @nastya 
So your chart will output the downloaded users as per the most recent value of their free_trial_group property during the selected chart time frame. To verify the expected behavior, you should see that these downloaded users should have the free_trial_group column value as 7_days since you are picking this from the most recent event.

Based on how user properties work in Amplitude, here’s what I think could be happening - these users could have been in the photos_count = 0 segment atleast once sometime during the chart’s time frame. Their most recent event could have the value for photos_count updated to something apart from 0, which is what is shown in the csv.

You can try picking some of these users ids and see how many times their photos_count property got updated during the time frame vs this value of their latest event.

Hope this helps.

@Saish Redkar thanks for the answer! Now I get it.
So I tried to get this data with segmentation and still the same behaviour


Could you advice on what instrument should I use to get the result I want?


Userlevel 7
Badge +10

What’s the exact question you are trying to answer here?

@Saish Redkar how many users have 0 or none photos_count in each free_trial_group. Ideally in a pie chart

Userlevel 7
Badge +10

@nastya 

If I understand this correctly, then you could try reversing your user composition chart -

composition by “photos_count” ( Most recent value ) against your trial segments : free_trial = 7 days and free_trial = 30 days. With this approach as well, you need to be aware of the time period of the chart. If the photos count is a property which gets updated quite frequently, then you will get the results accordingly. You can also try using the cross-property values clause to see how many users have had multiple values for this property.

Hopefully this works out.

Reply