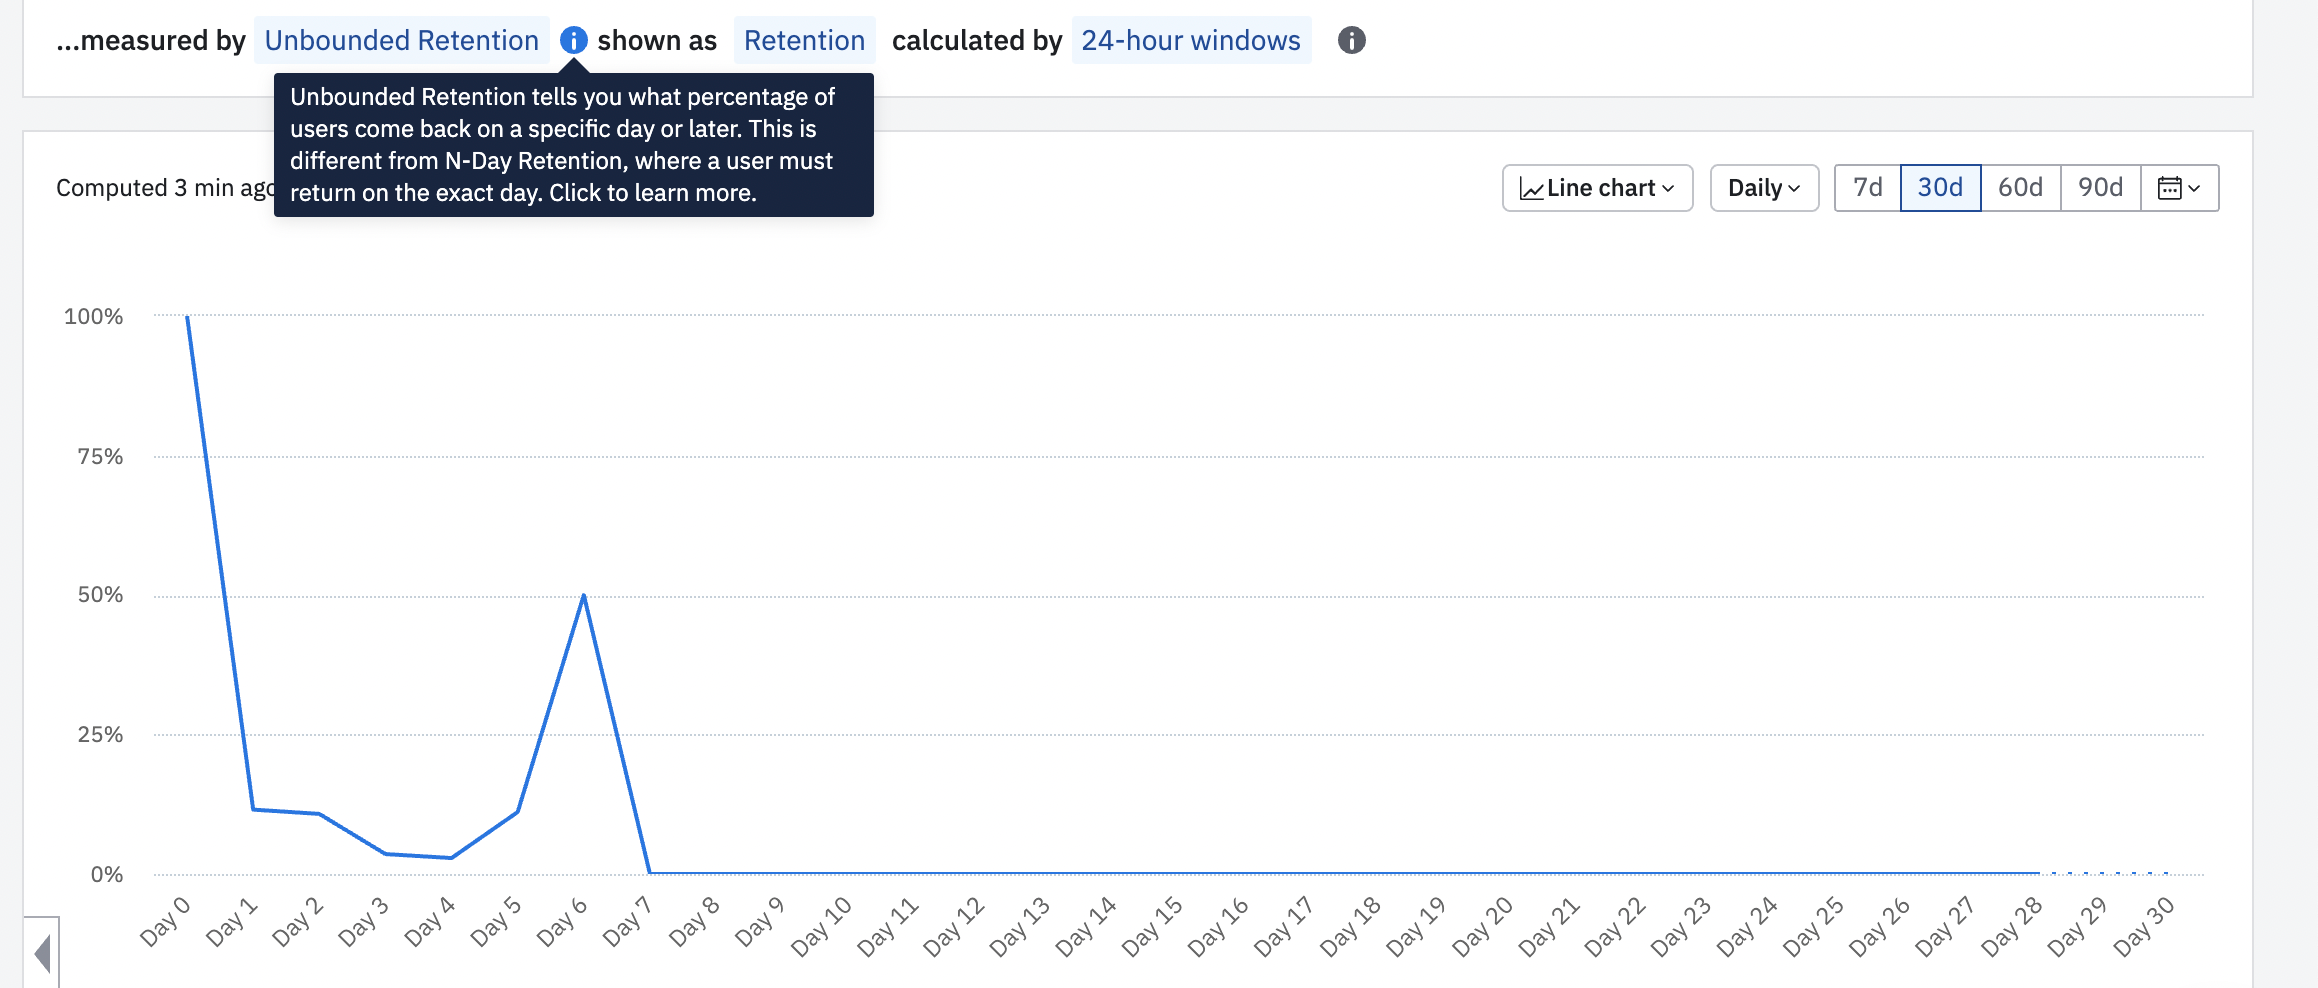
I have 2 problems with retention graphics
- N-day retention shows me on N-day it’s 50% or bigger retention, BUT on 0 day there were 90 users in cohort and on N-day returned only 2 of them. How is it possible 2 of 90 - 50%?
- Then I decided to check unbounded retention and it’s defenetly broken. If I’m not wronged, unbounded retention can not show us 10% on day 4 and 50% on day 5
Is it something wrong with our events? But we send them and it works.
How can I fix it?


