Hello Guys!
Here is the deal:
We work with an B2B product, so most of our metrics look to how many companies triggered certain event during a window of time. Most of amplitude is perfectly usable for us, because even with all tracking being made by user, we can always use the “Group By” feature and everything is good.
But there is a problem. I want to see on my dashboard the actual number of companies that triggered that event. I can get a list of them easily, but when showed on a dashboard that data is not easily read. I’d need to download a CSV and count the cells.
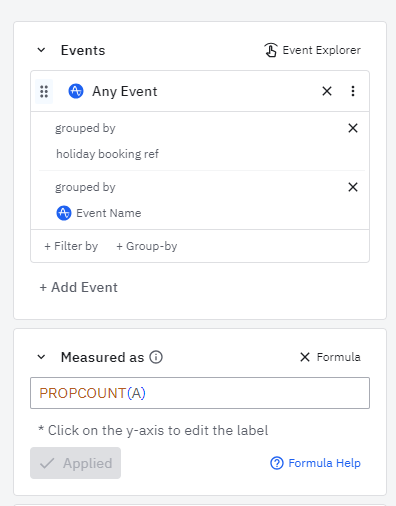
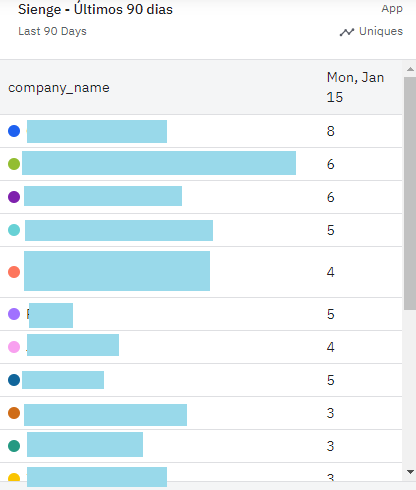
Let’s use the image below as an example. I created a segmentation graph with event i needed, grouped all users by company and then added that to a dashboard. For good measure, i turned it into a table, for ease of reading. Now i can see who triggered the event, but not how many companies, and that’s even worse on this case where there are 165 companies that triggered the event.
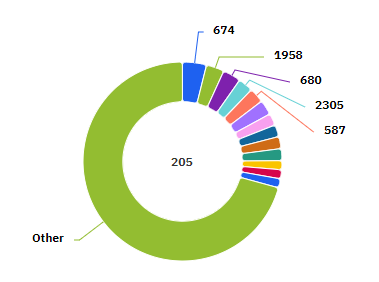
I also tried to use user composition, so that i could see the exact number, but that doesn’t really work, because the number at the center of the graph is the sum off all users, and not companies, that saw the event.
Is it possible to do something like that with the tools available ?