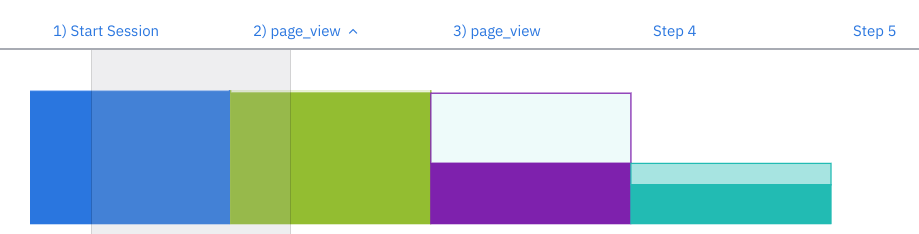
I’ve created a User Journey chart but the titles of each column are all the same.
We are injecting an event every time a user transitions a page.
The event is named ‘page_view’ and contains an event property page_location.
My problem is that the column headings for each step show ‘page_view’ when I want them to show the value of the ‘page_location’ event property.
How do I change the chart to show this.