Solved

Not seeing data from bigquery

  • 10 July 2023
  • 6 replies
  • 283 views

Hi, 

I have added all the BigQuery tables as sources into Amplitude. I can see events being ingested from Bigquery as well under the ingested events but I can’t see the events in `Events` section?

While there is not ingestion error and even if there is one, I can see 7 out of 10 events being ingested, but no Events found on the graph shown for last 7days neither under the Events section.
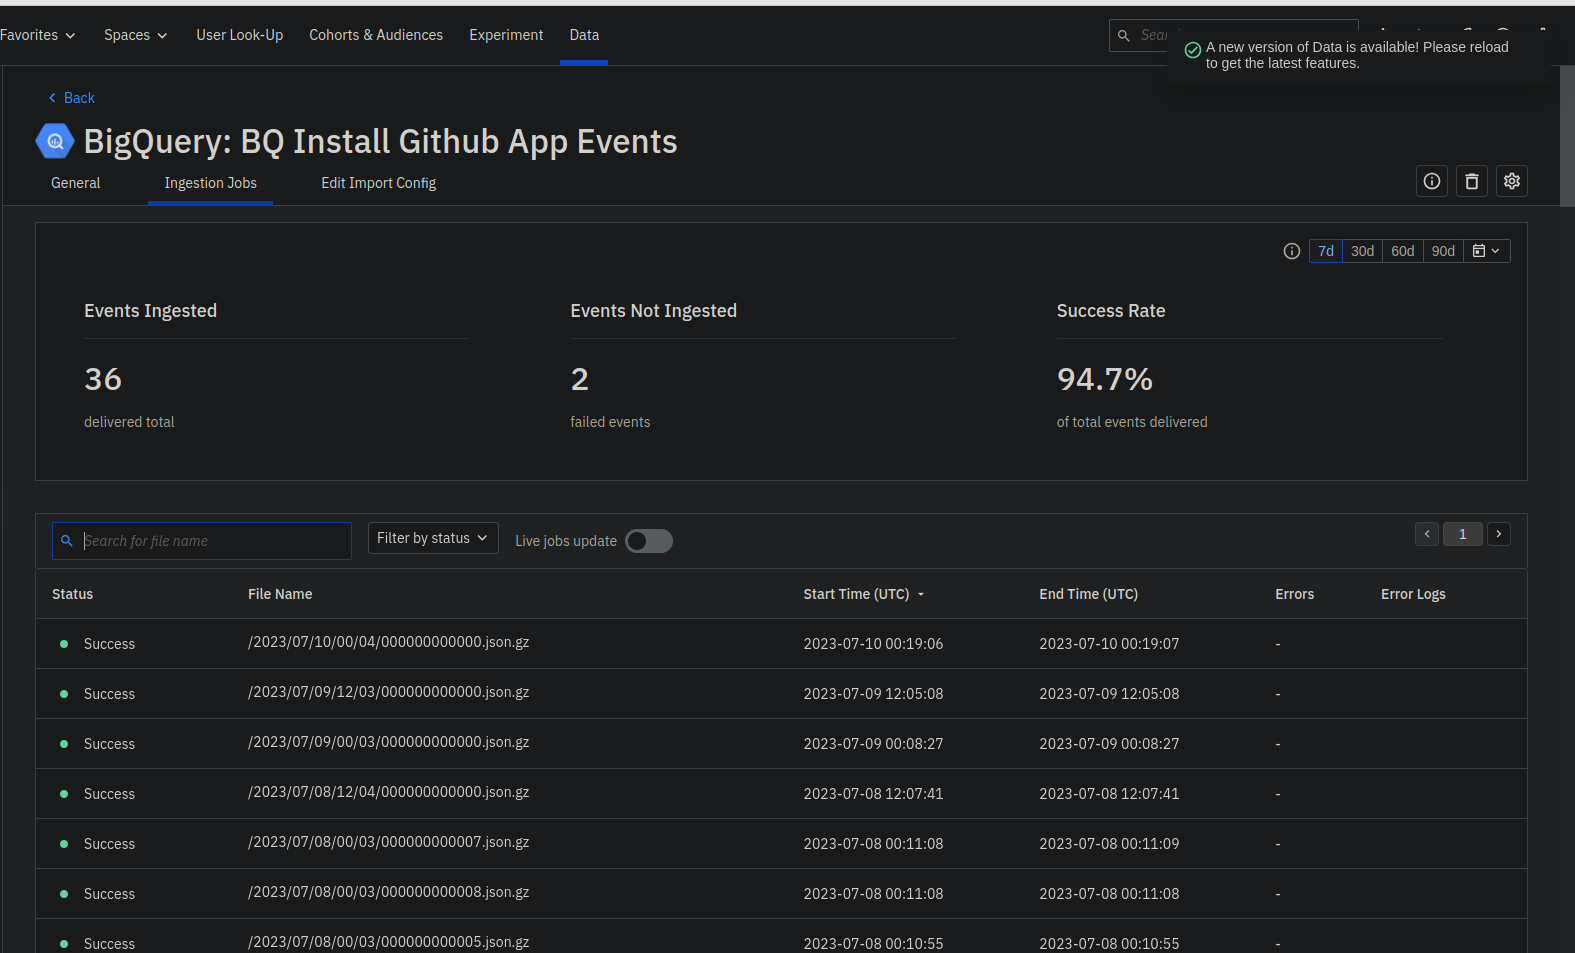
The screenshot:


icon

Best answer by Saish Redkar 18 July 2023, 17:27

View original

6 replies

Userlevel 7
Badge +10

This looks to be an ongoing issue for a while now, similar to these ones

@Esther Trapadoux maybe someone from Amplitude’s data pipeline team can jump in here if they are aware of this.


Userlevel 7
Badge +10

Adding @Taewoong Seo ‘s issue in this thread


@eddie.gaona@Yuanyuan Zhang  @Esther Trapadoux 
Is this a known pipeline issue on the engineering side or some config settings which seem to be missing?

Looks like quite a few users are facing this issue for the past few weeks.

Userlevel 5
Badge +5

Thanks for bringing this to our attention @Saish Redkar!

@Muskan Paliwal From the top of my head, I can think of a few potential causes: 

  1. your schema settings in data is set to reject new events
  2. you have block or drop filers to block events
  3. the event types you ingested are deleted or blocked. You need to filter for “Deleted” status in Data to view deleted events. 
  4. the event type is reached (usually it is 2000 for each)
  5. the chart shows events based on event time, but server upload time. So if you events have event time that is older than 7 days, they will not show up in the chart with 7 days range. 
Userlevel 5
Badge +9

Hello @Muskan Paliwal hope you are well!


As @Saish Redkar mentioned there are other community posts about a similar topic. While I haven’t checked your BigQuery setup here is another reason why you may not being seeing events ingested into Amplitude, here.


Hope this helps!

Thanks for bringing this to our attention @Saish Redkar!

@Muskan Paliwal From the top of my head, I can think of a few potential causes: 

  1. your schema settings in data is set to reject new events
  2. you have block or drop filers to block events
  3. the event types you ingested are deleted or blocked. You need to filter for “Deleted” status in Data to view deleted events. 
  4. the event type is reached (usually it is 2000 for each)
  5. the chart shows events based on event time, but server upload time. So if you events have event time that is older than 7 days, they will not show up in the chart with 7 days range. 

Hi @Yuanyuan, I have checked all the points you mentioned above, We have not set settings in data to `reject` any new events. We don’t have any filters set for blocking or dropping events.  But I can see the events in the `delete` status under the `data` section. I have restored all the events but I am still confused how did these events get into the status? 

Userlevel 7
Badge +10

@Muskan Paliwal 
In case you missed Eddie’s response to a similar issue

The reason could be the use of `CURRENT_TIMESTAMP` for your time based import.

Timestamp column required for time based import only, usually server upload time or database insertion time, must be in TIMESTAMP. In other words, provide a valid created_at timestamp column to use time-based import. CURRENT_TIMESTAMP or NOW is not a valid value.

The documentation on time-based imports can be found, here.

Reply