Hey everyone! Long-time Amplitude user who just joined a new company (who, thankfully, is also using Amplitude!) and I’m getting up to speed on our data & data models.
I may be overlooking something, because this feels relatively simple. How can I show a simple trend (a la a Segmentation chart) for the volume of users (unique) who performed the final event in a funnel?
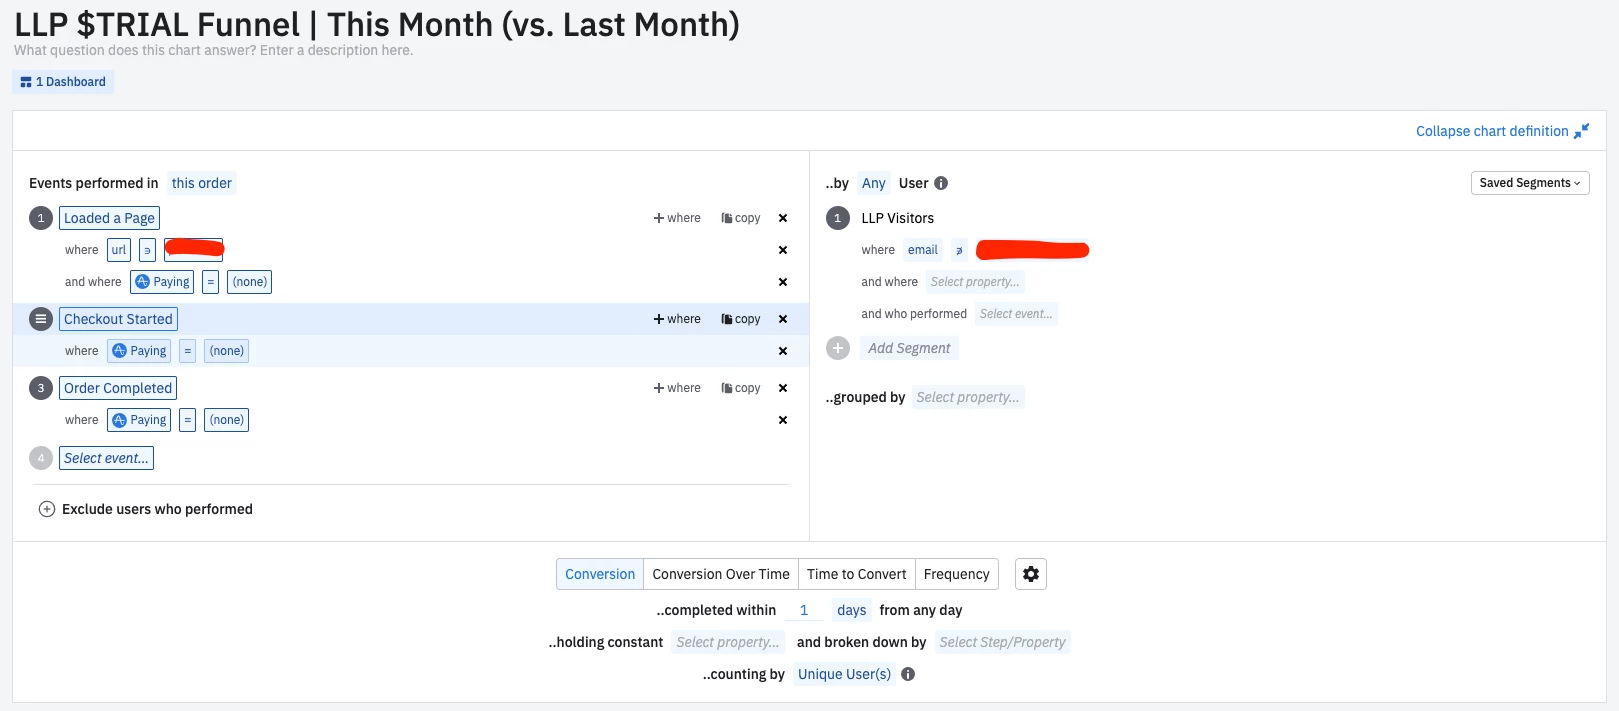
Here’s my funnel setup. As you can see, I want to see the Free Trial pull-through of users who visited a particular page (call it PAGE GROUP A) on our site.

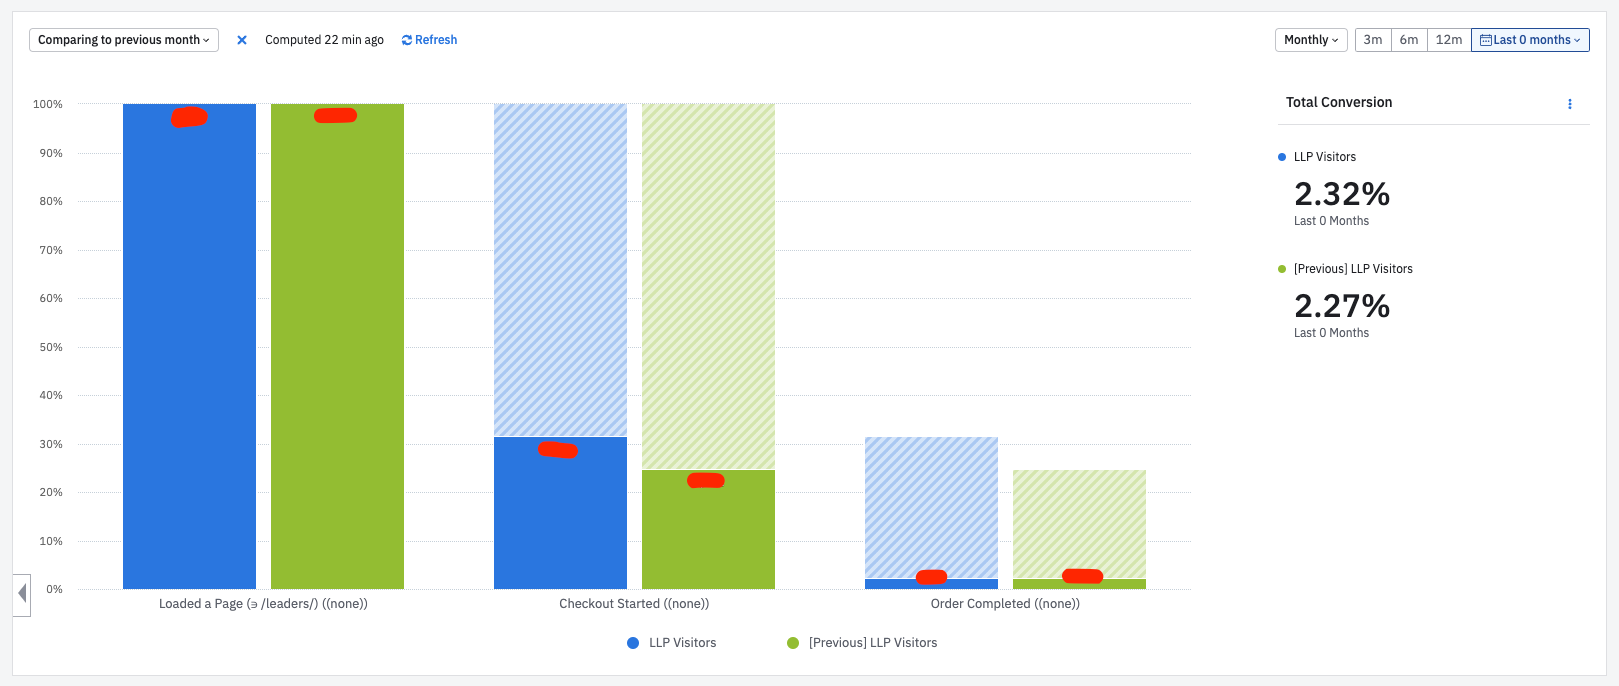
Which yields this funnel chart (comparing this month to last month)

So far so good!
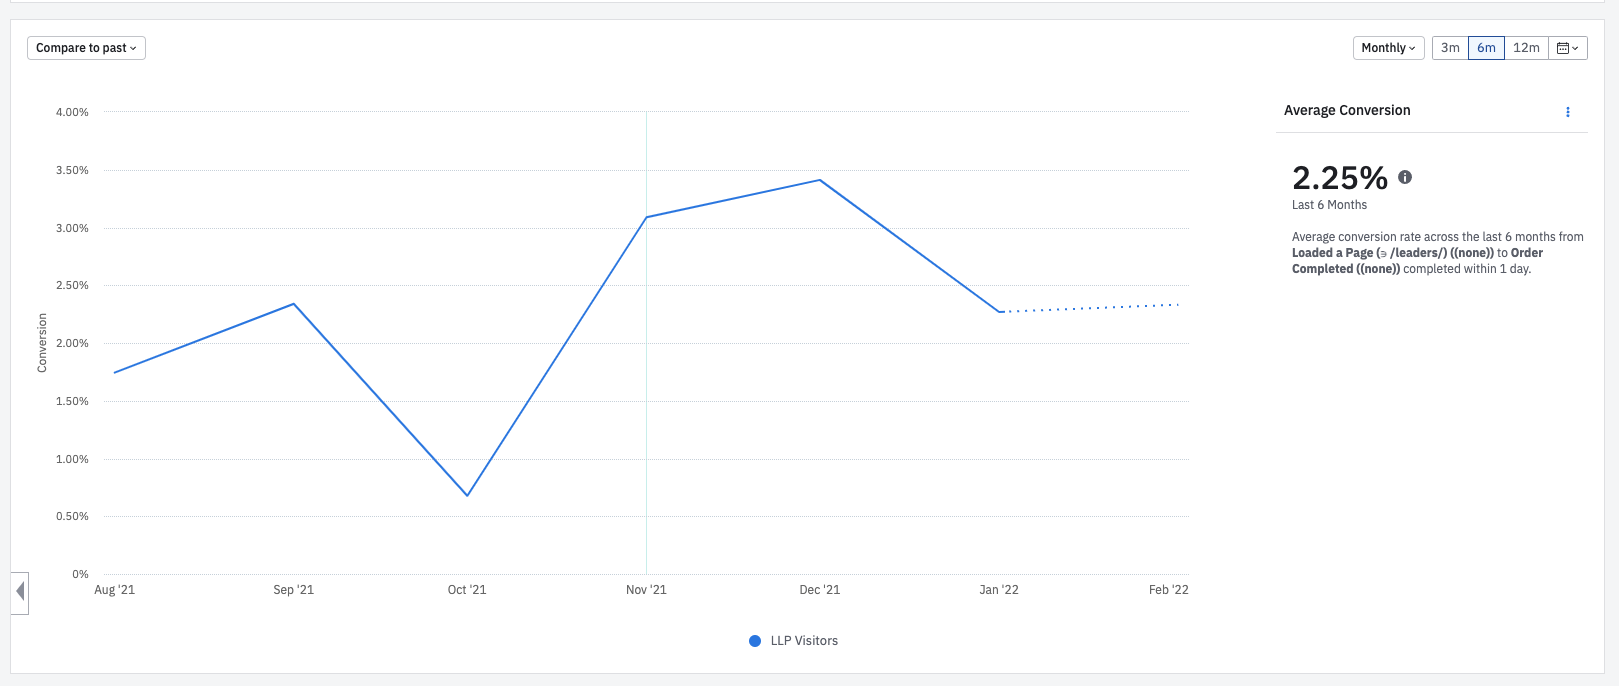
Next, I can trend the Conversion Rate like so:

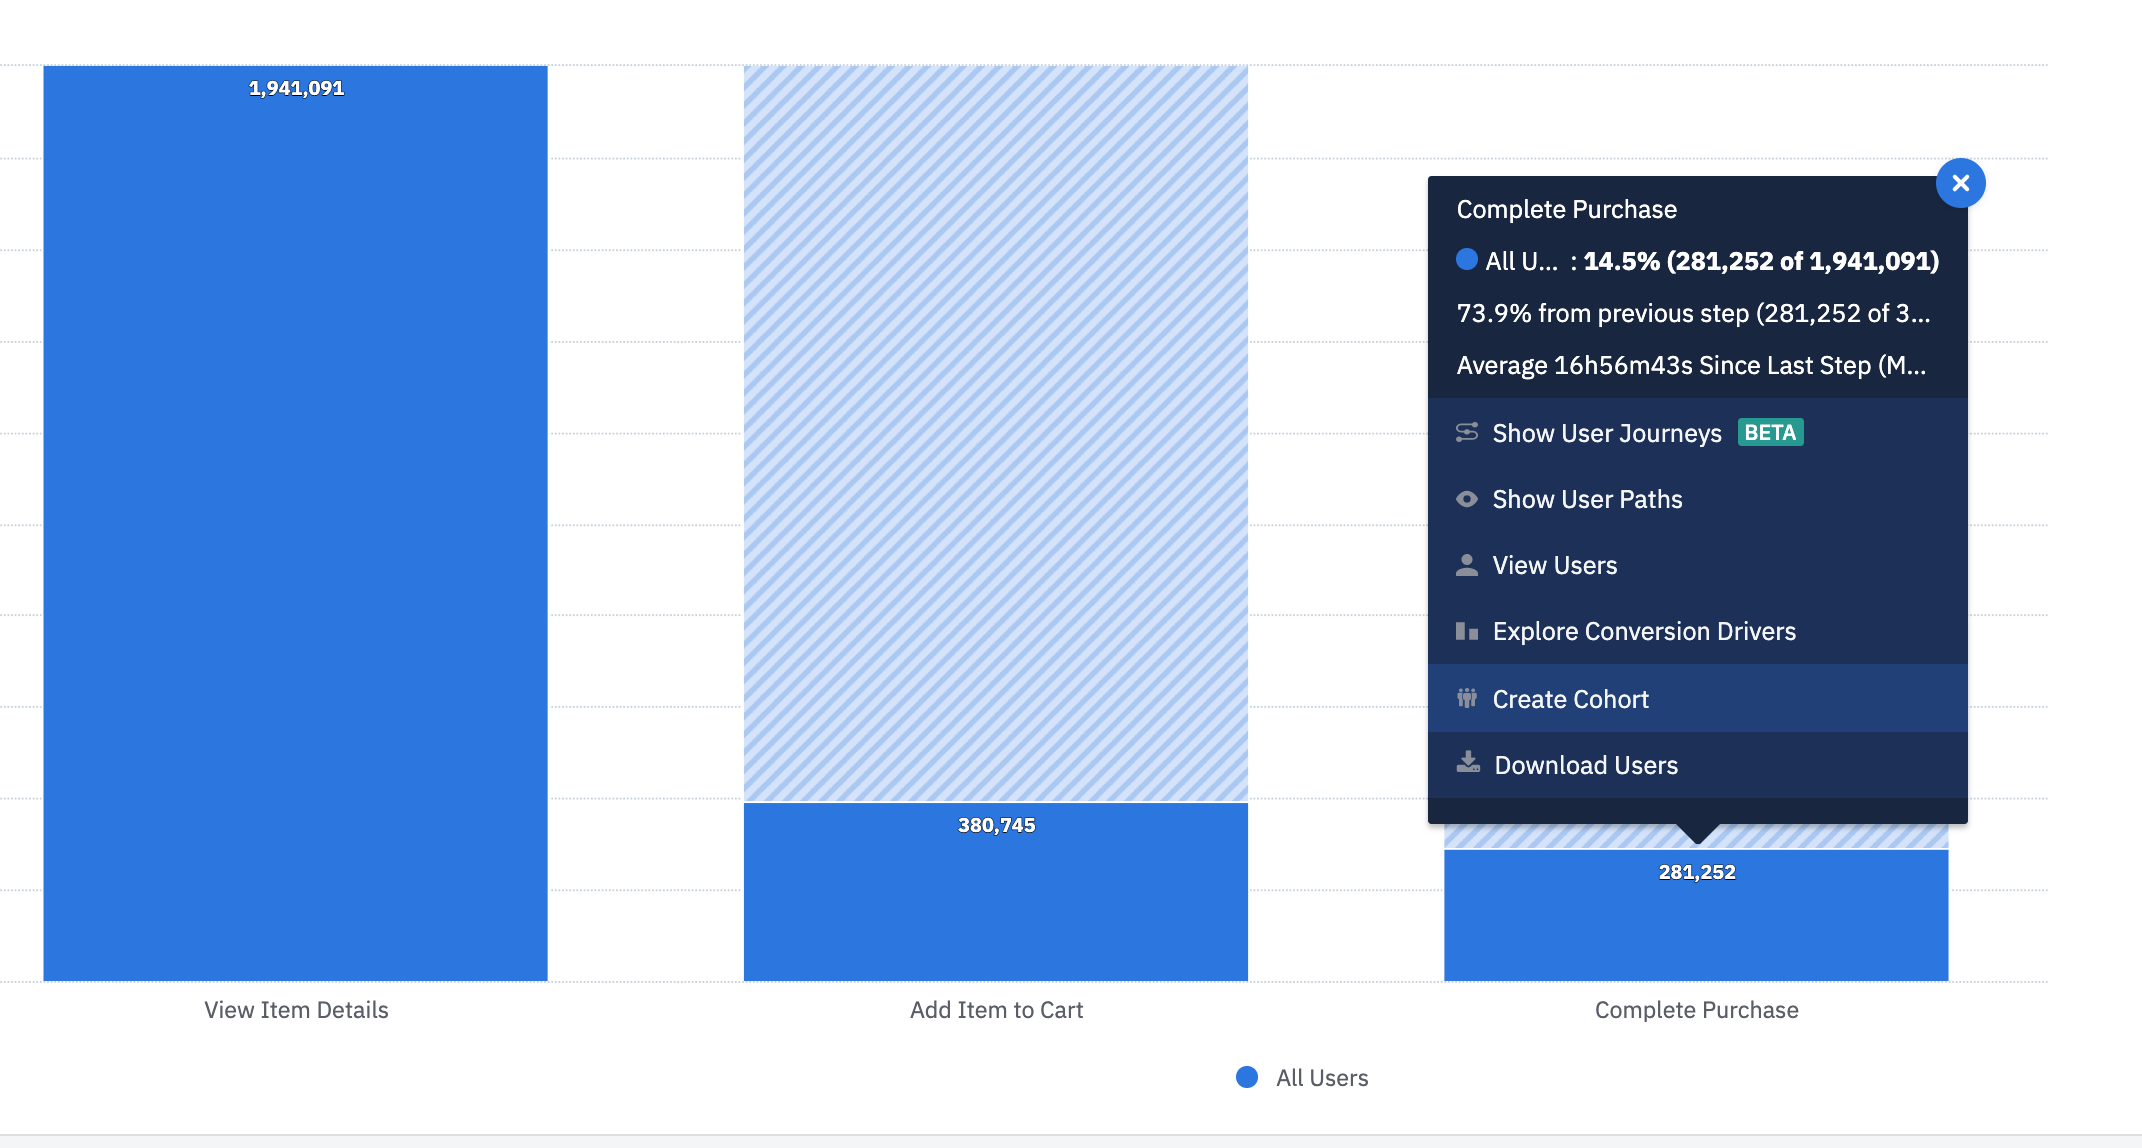
Now here’s where I’m stuck: I want to be able to trend not the conversion rate but the actual volume of users completing the final step of the funnel.
- I first tried to see if I could use a plain ol’ Segmentation chart for this. But the filter logic isn’t robust enough to say “only show me Users who completed X event where Y event property contains Z string”, so that was a dead end
- I don’t see any obvious way to switch “conversion rate” to “raw count” on the Funnel chart
Feeling stuck, and also feeling like the answer is obvious. Thanks in advance for your help :)


