Hello. I am trying to do:
- Create a chart when users made withdrawals (payments)
- Add to this chart the dates (deadlines) when users are prohibited from making any withdrawals (payments)
What I have:
- Withdrawal (payment) events when users have performed them
- An array of dates (deadlines) in user properties.
What I did:
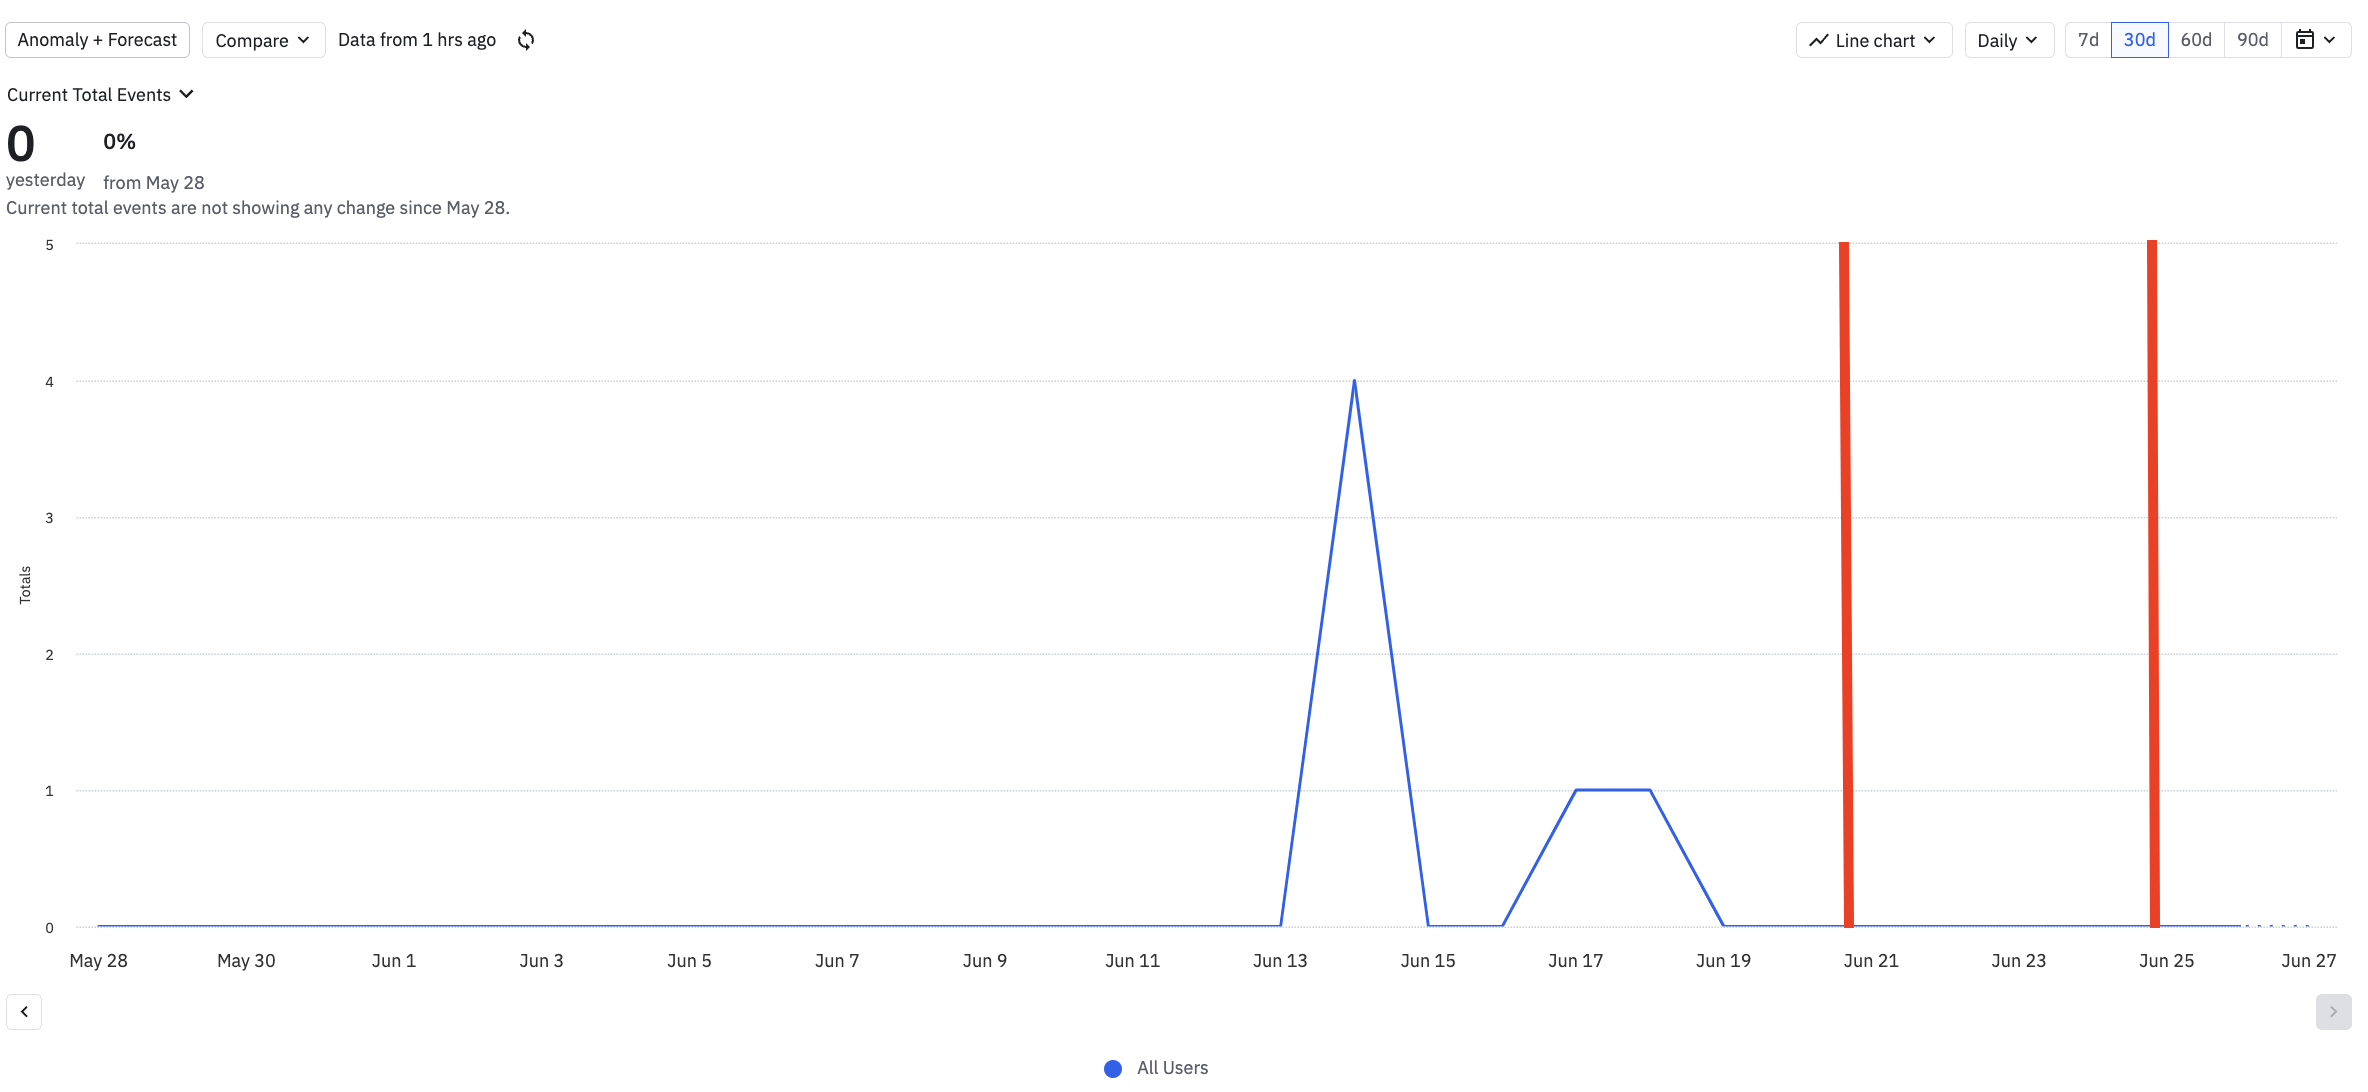
- Created line chart in segmentation
- Added event withdrawal to the chart
- When I try to add dates to the chart from the user properties, I get nothing
What I expected:
Any idea how I can solve it maybe in the other way, because I think the chart does not support it ?
I will be very grateful for any help

