Hi, hope this is the right thread to ask this..

I spent half of the day experimenting and thinking how to achieve chart that I want - unsuccessfully..

I want to know: How many unique users change same entities in our system.

In my domain we have entity (Campaign). It’s accessible for multiple users.

Campaign has an ID (unique per campaign), I get ID with with Save event in event props. Next to that I have user info as well like Profile Name/Id etc..


Now the ultimate goal is to know how data is distributed - how many people usually Edit and Save single campaign.

So eventually to know how many people usually work on single entity during entity lifecycle.

Currently I have this view by simply:

  1. Go to Event Segmentation
  2. Select Save event
  3. Select Frequency

And I assume it already shows split of how many times Campaigns are edited (but still I’m not sure if this is true since adding where and selecting all available IDs changes my results)
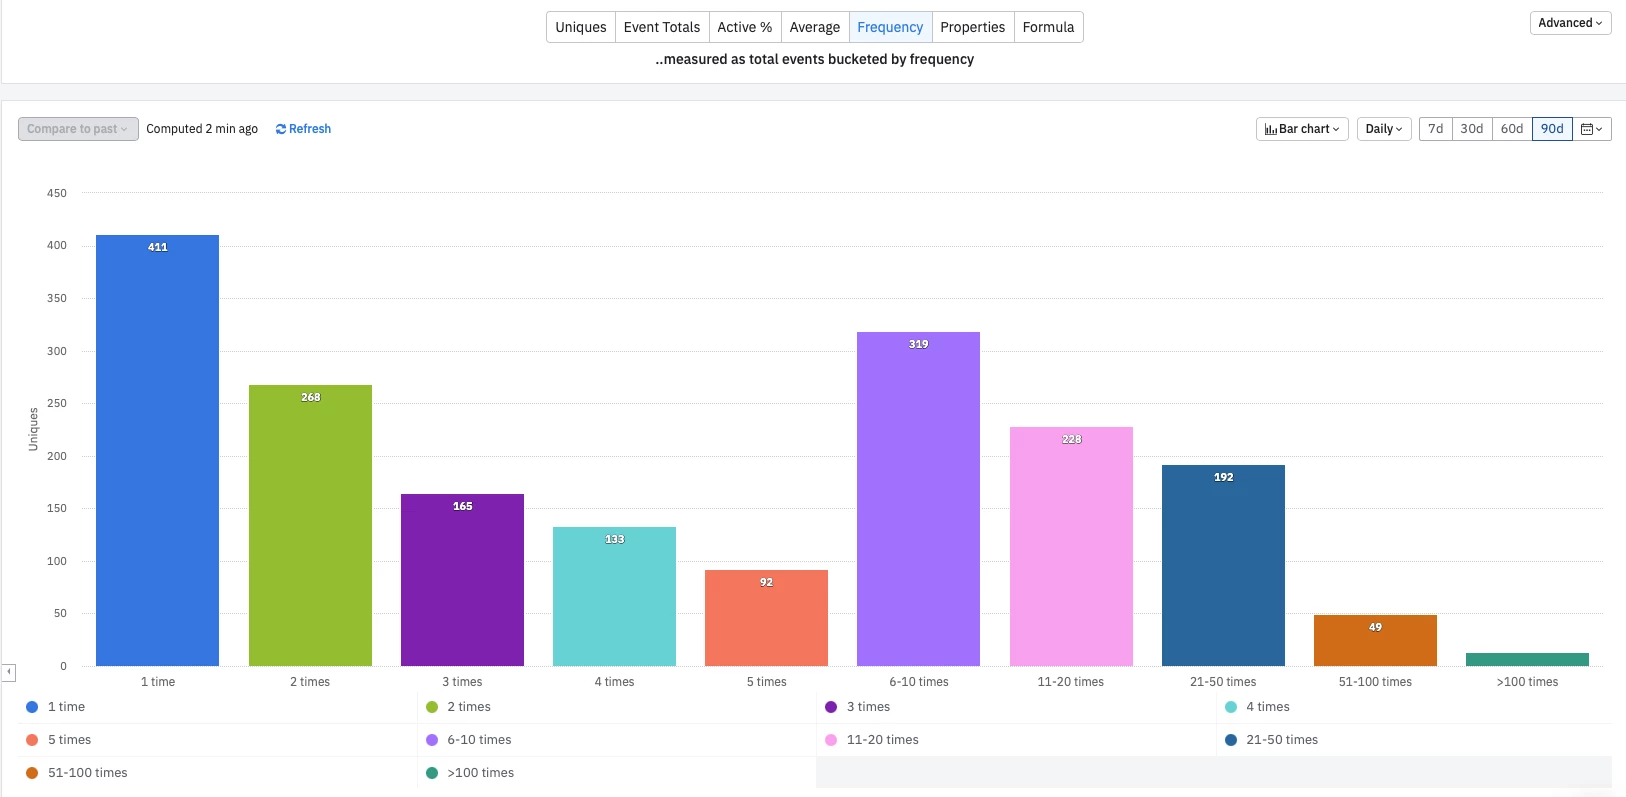
 

Anyway, any suggestion how I should build my query so I see similar split for Unique users aditing the same campaign?


I assume X axis is:

  • 1 user
  • 2 users
  • 3 users
  • etc…


and Y axis is:

  • number of campaigns (for selected period)


Thanks a bunch!

Hey @eimantin 

From what I understand, your use case is a bit tricky to approach in an event seg chart directly. You can mostly get the modular view of how many edits and saves happened on a given campaign id within a time interval.

I would take an alternate approach to this using a funnel and ask the question - of all the campaigns that get edited, how many get saved ( assuming there are Edit and Saved edits with the same campaign id). T

This can be done using a funnel chart with the following params -

  • This order funnel with Edit → Saved event ( assuming that a campaign gets edited first and then saved)
  • Holding the campaign id constant
  • Looking at the frequency metric

Something like this - https://analytics.amplitude.com/demo/chart/new/quticwc


This might not work exactly how you want, but you can give it a try.

Another approach would be exploring how to instrument these campaigns as entities via Account Level Reporting. The doc mentions about “Tracking how many charts are copied, saved, and modified in your organization, and then identifying which ones are interacted with most often (group by chart ID)” which might mirror your use case precisely.


Hope this helps.


Thanks for looking into my question @Saish Redkar 


Tried your suggested way but does not seem to work out for me. 


But maybe I found a way how to achieve this let me know if I interpret the chart correct.

I build a funnel chart and added Campaign Saved event 9 times, so user has to complete this in “this order”.

Now I’m holding a constant for a campaignId and profileName so it takes into account campaignId and profileName uniqueness (also setting a rule that saves should be completed in 30 days from first Save)

It looks that now it shows something I need?

Thanks again


Reply