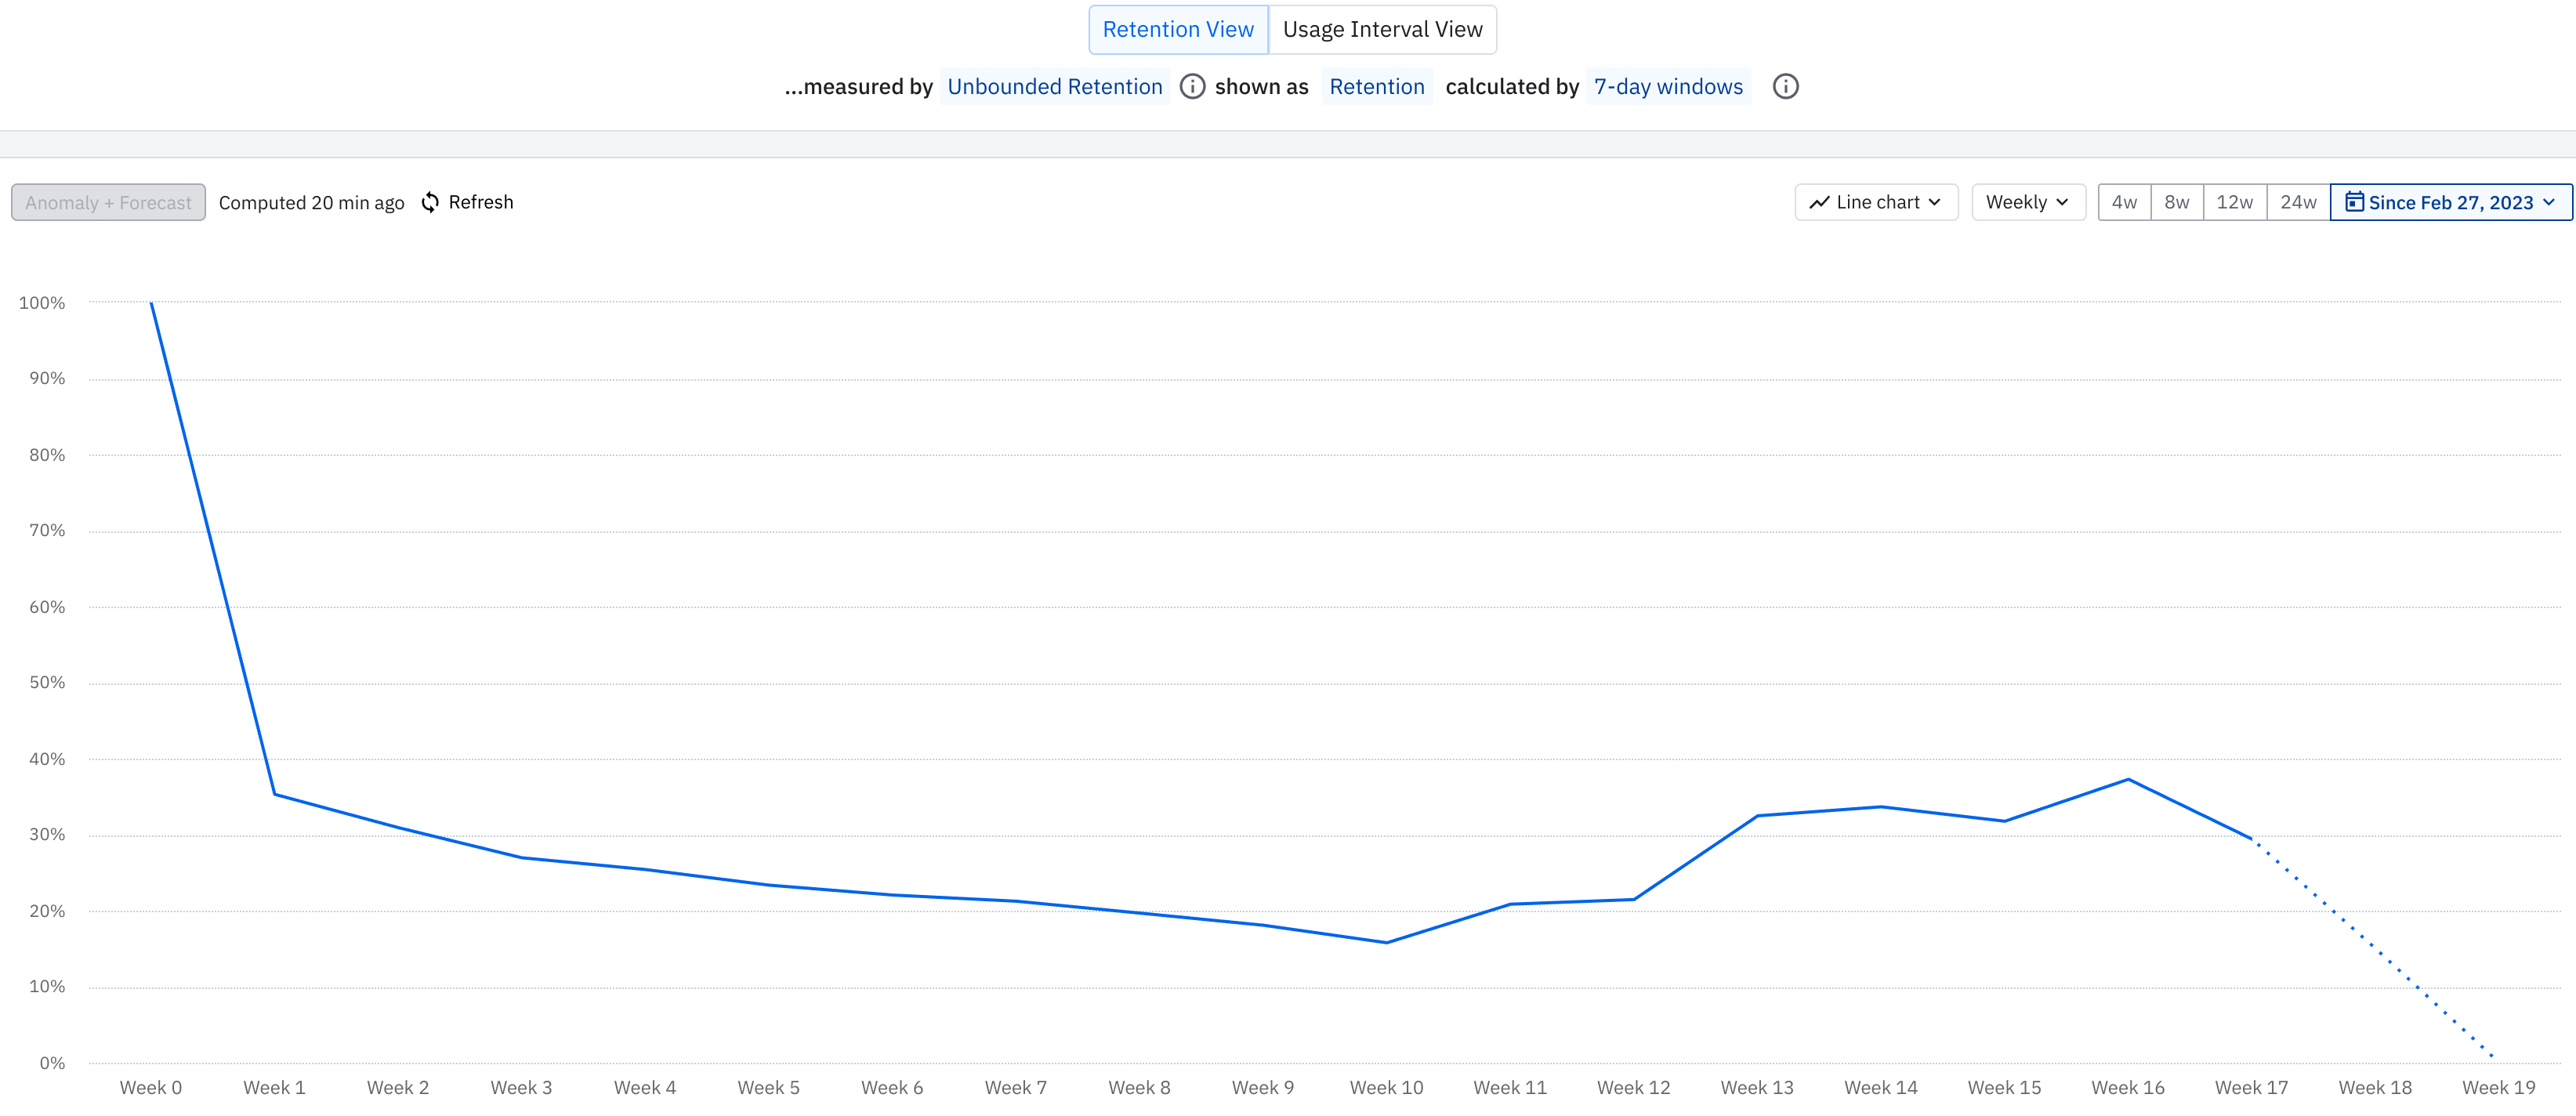
I don’t understand this retention chart. To me, it doesn’t make sense that it could grow at the end like that, it should only decrease over time, no? Because if a retention at say week 14 of 35% means “35% of the users performed an event at or after 14 weeks since signing up”, then every week before week 14 must have a retention of at or above 35%.
