Hi @ivanb thank you for reaching out here. Could you please share your Amplitude org id, or a hyperlink to your org settings page? I can help investigate this week.
Hi @JennRu. My Org ID 199285. Link. Thank you!
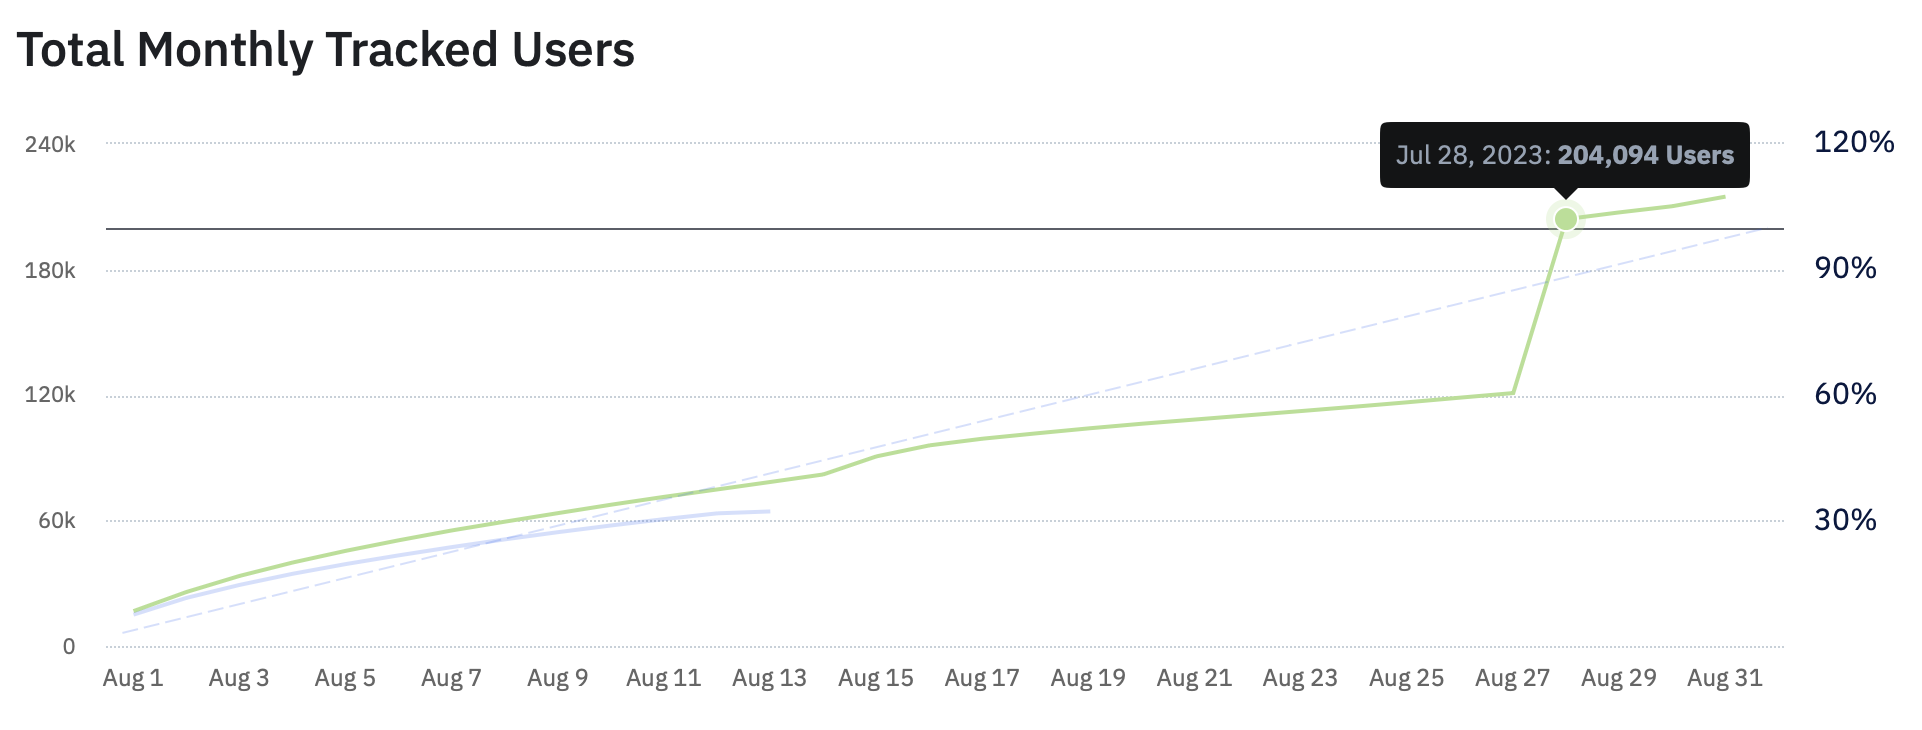
Hi @ivanb the Amplitude team is still investigating this. I surfaced this to a few additional team members to see if anyone can share more details. What I’ve found so far
- I built this chart in the main Prod project to investigate any noticeable spikes in the data on a daily trend among users performing any event, segmented by
- anonymous users
- identified users
- all users
- I modified the chart to monthly to get end-of-month counts ochart] and broke it up individually by
- I also tried summing up the unique device ID’s from anonymous users with the identified users for each month
- June lchart] - this sum was the closest to the max MTU limit
- July >chart]
- I conducted a similar comparison in the Dev project chart]
- I verified none of your projects had logged any drop filters
- I verified the libraries in which data is being sent to amplitude chart] to verify there were no undercounted identify calls from upstream CDPs, such as segment
I can’t conclude anything just yet, as there might be something I’m missing on how we received data vs how we can report on it in this chart type. I’ll respond back here as soon as we hear back from the team.
Hi @ivanb following back up here, our team investigated this further and identified both projects were backfilling events for prior months. However for a unique user in June that is backdated for previous months (say April), it is treated as an additional MTU that is counted in June, the month they are received in.
Please review the stacked bar charts below to identify data that was backfilled for previous months. We count MTUs based on the server upload time (i.e. when Amplitude ingests the data). The unique user counts from the blue bars add up to the total June MTU count, and the unique user counts from the green bars add up to the total July MTU count.
Production project: https://app.amplitude.com/analytics/bloodoxygenapp/chart/8smboxit
Dev project: https://app.amplitude.com/analytics/bloodoxygenapp/chart/8smboxit/edit/wa6saboc
Would your developer be able to share more details on how they’re sending these events to Amplitude with older timestamps? Typically when we see backfilled data, the library source utilizes our batch api but that doesn’t appear to be the case for this data.
Let us know if your engineer can share further information on that. In the meantime, I’ll update the article to include counting backfilled data.