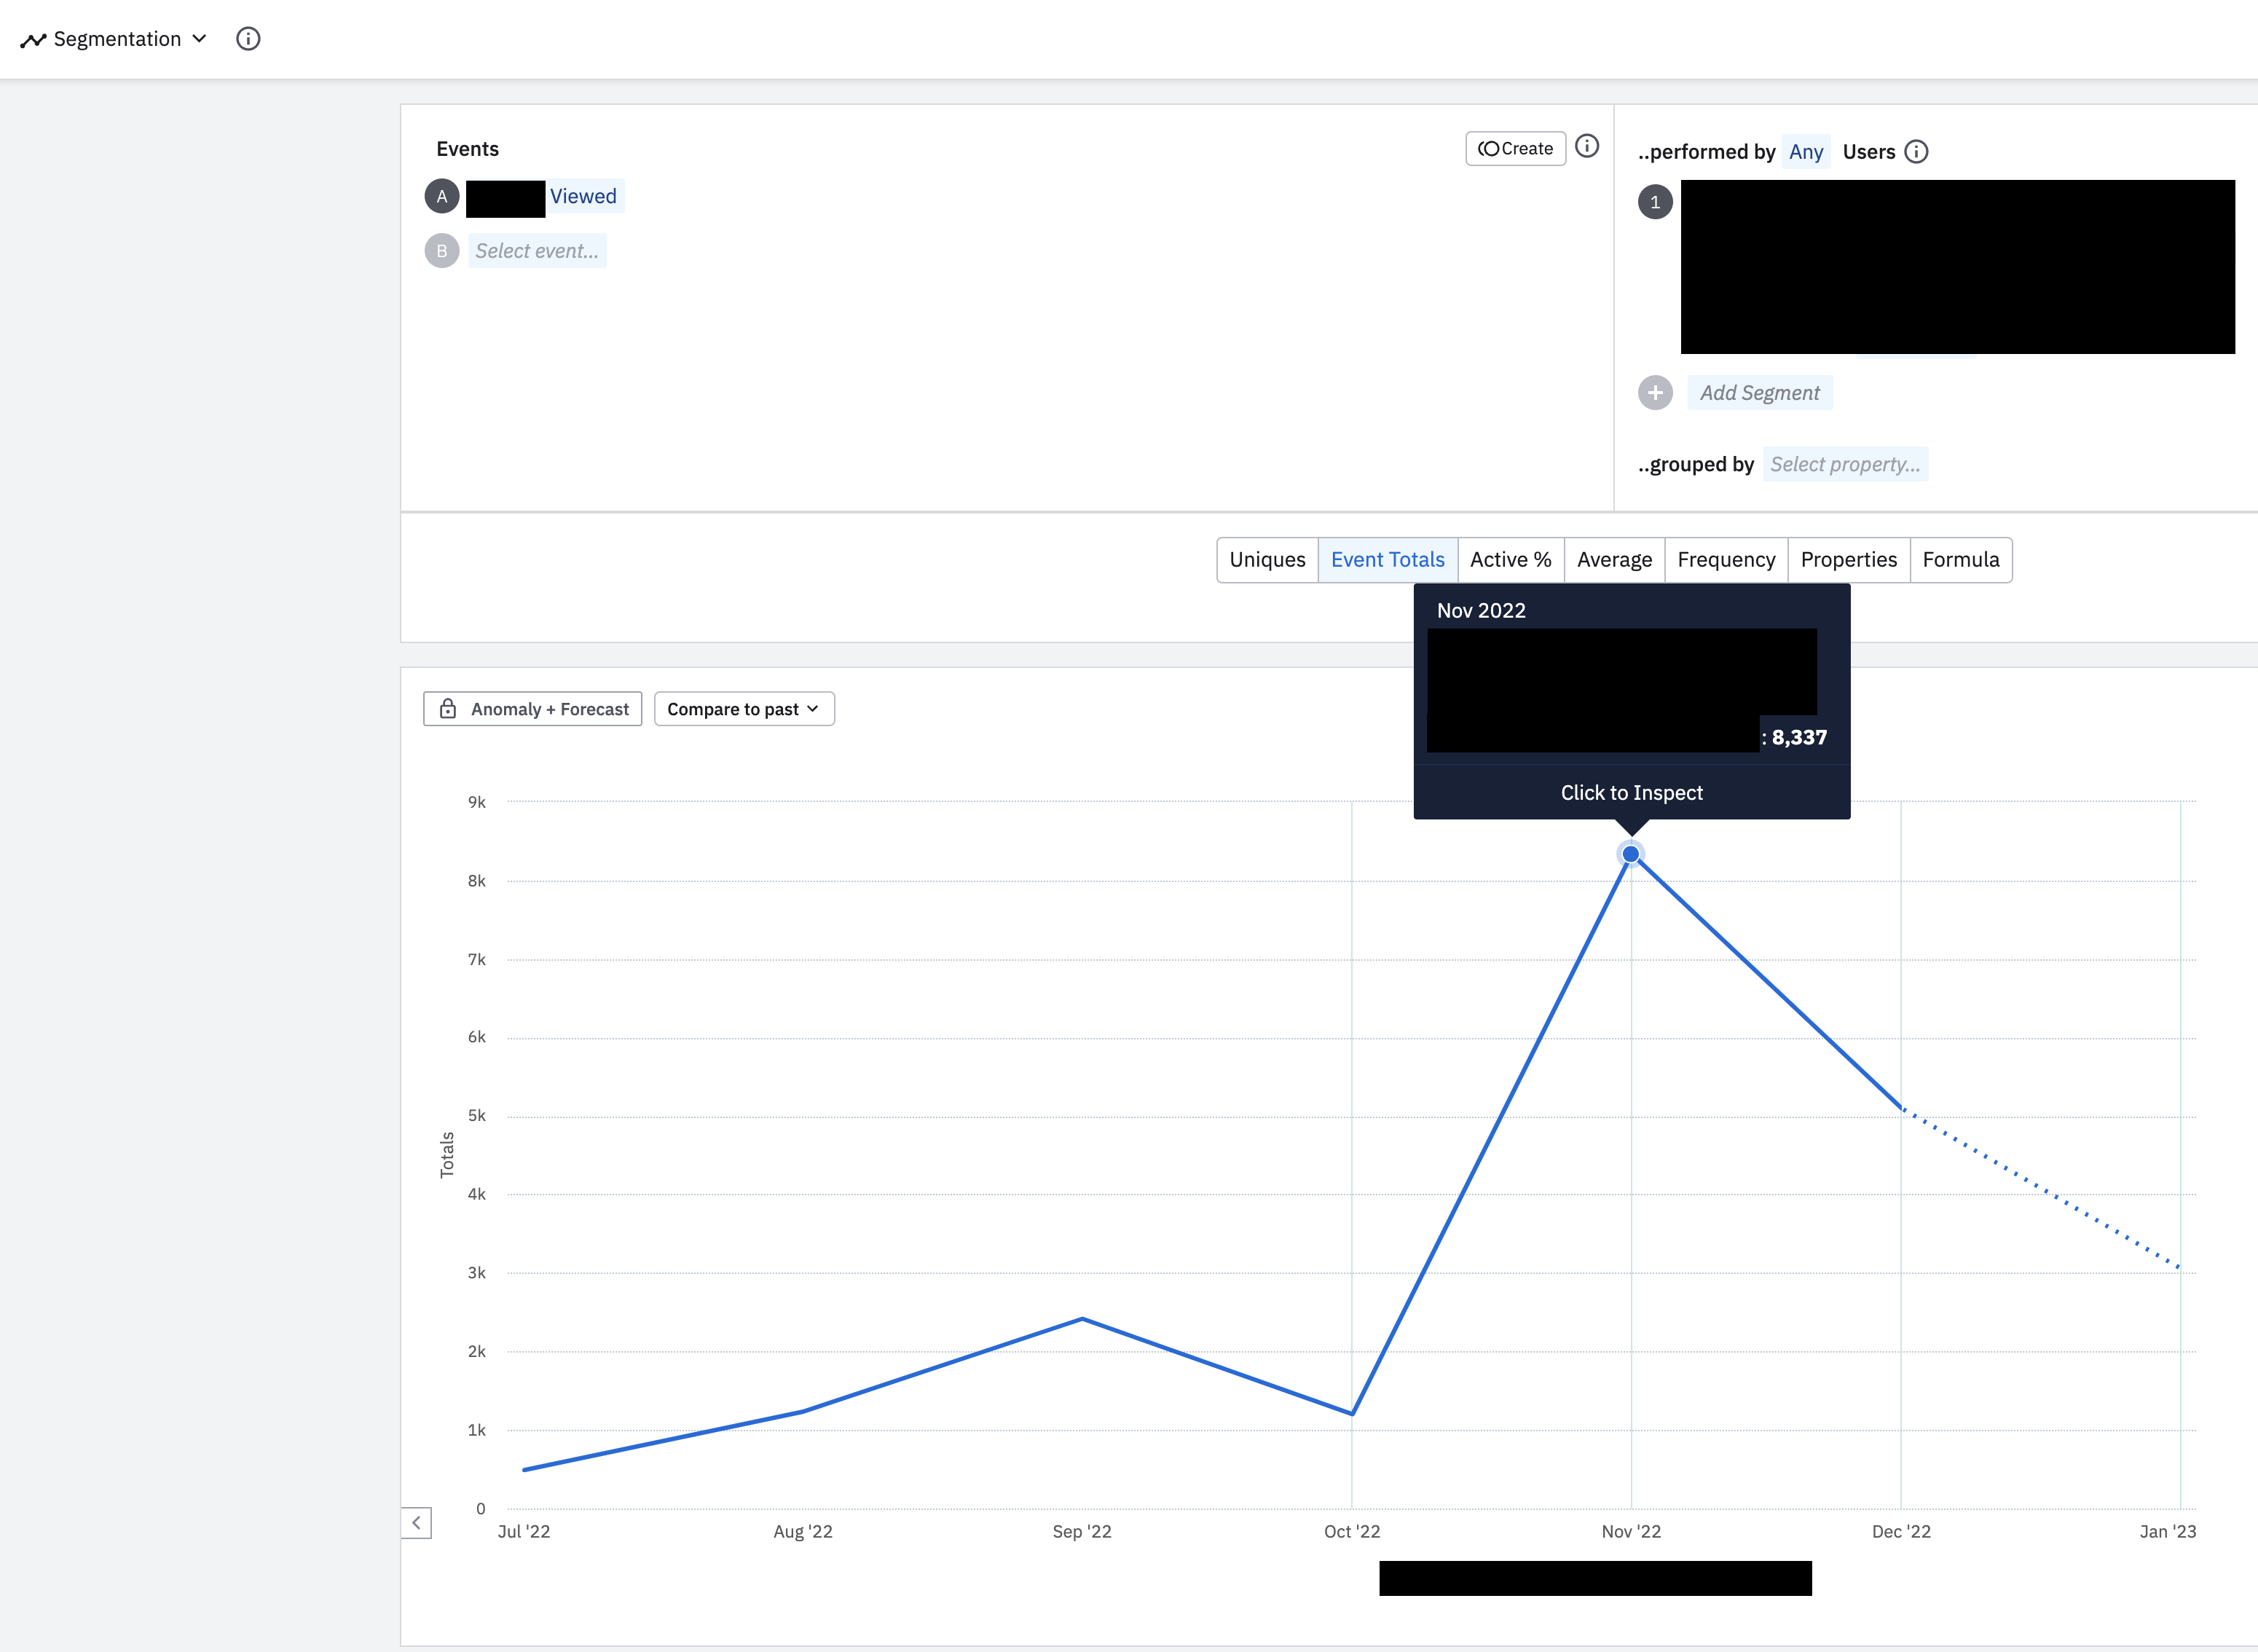
When I look at the TOTALS for my event (‘Entity Viewed’) in Segmentation for the month of November, I am seeing 8,337 event totals.
When I look at that exact same event (‘Entity Viewed’) in Funnels for the month of November, I am seeing 767 - a drastically different “of” number than I saw seeing in the Segmentation analysis. What’s weird is that if I include a “holding constant” property, that 767 goes up...
My understanding of Funnels is that if I choose the “Events performed in this order” option, then the first step of the Funnel should be the TOTALS, and the subsequent steps are only counted if the preceding steps (events) have been completed. I expected the TOTALS of that event in Segmentation to match the “of” number in the first step of my Funnel. Is am I misinterpreting how this works?
*I have used the exact same event and same cohort properties in the top right module in both the Segmentation and Funnel analysis.
Screenshot of my Segmentation:
Screenshot of my Funnel:

Help!