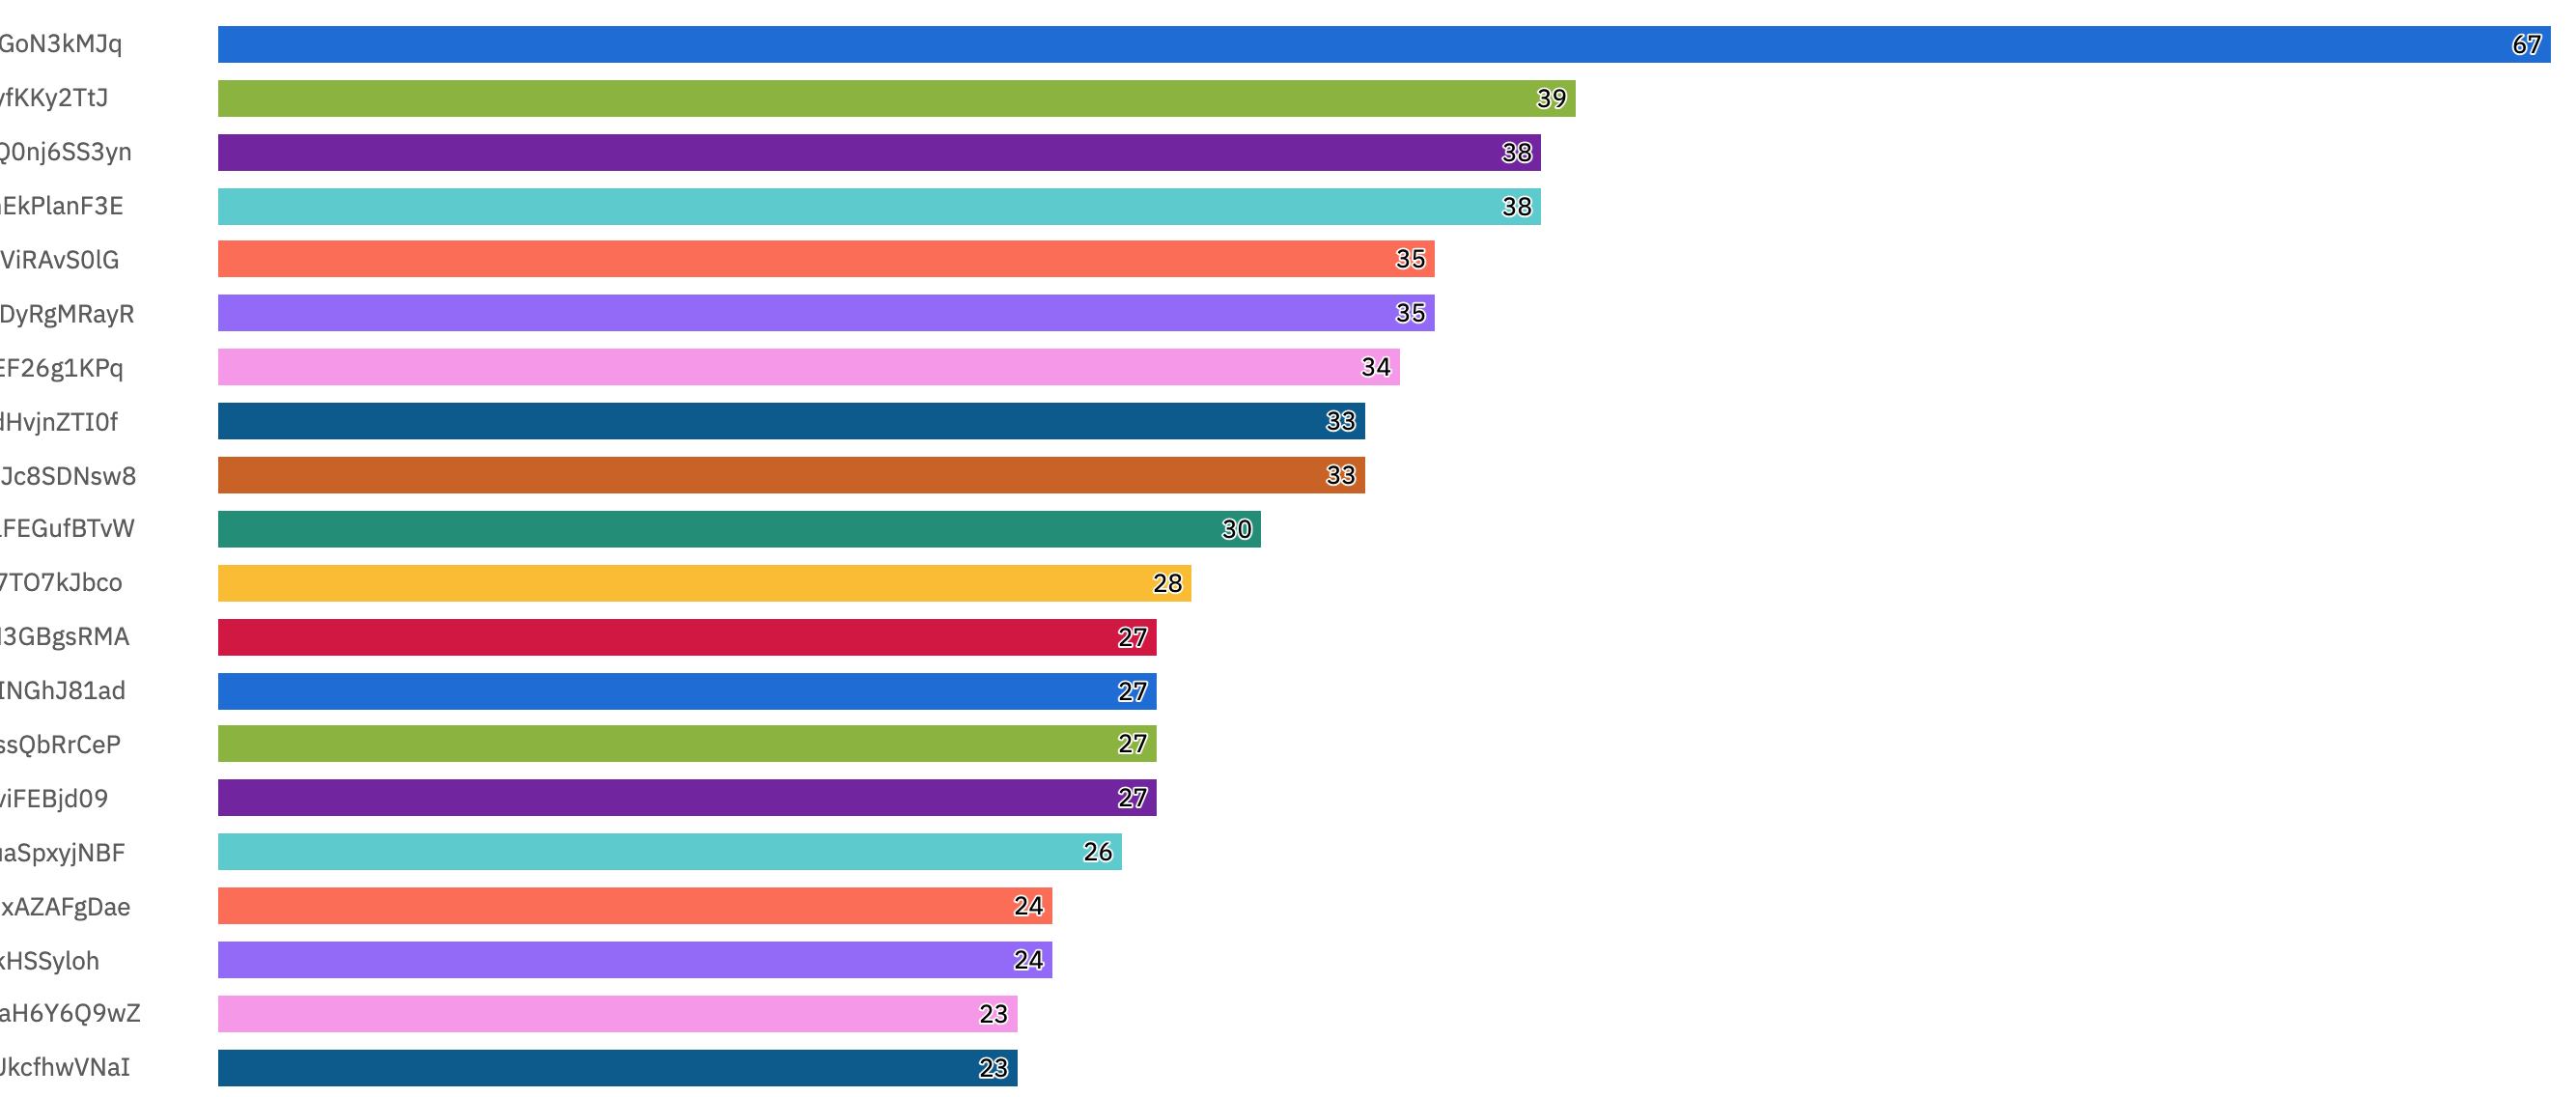
We’re tracking an event when a user attends one of our sessions - grouping these events by the session ID, we’re able to see the attendance for each session (see below):

What we’d really like to see is the data organized a little differently - a histogram of how many sessions were attended by 0-20 members, how many were attended by 20-40, how many by 40+. Is there any way for us to do this?