Solved

Tracking new Groups

  • 22 March 2023
  • 2 replies
  • 121 views

Hi,

I want to track new groups added (in the “Accounts” addon) in a chart.

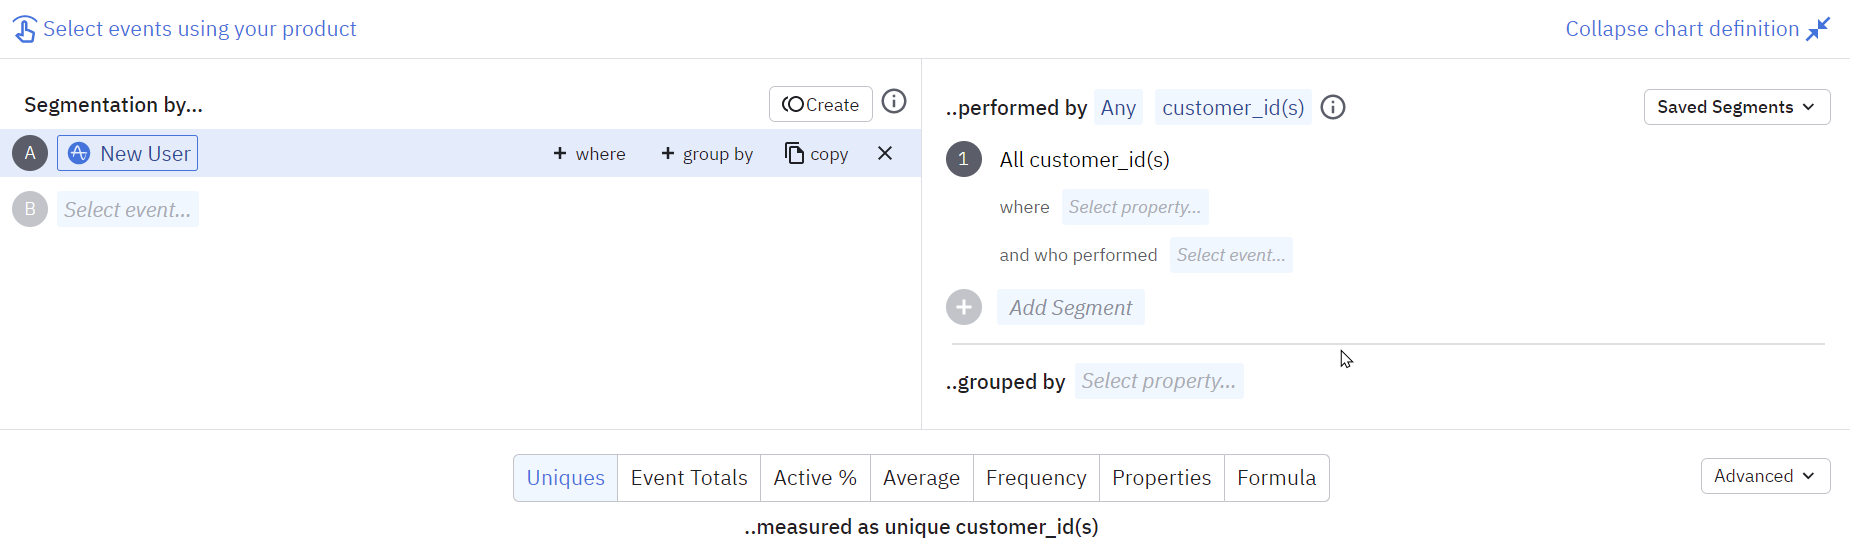
So far I select “New Users” and “performed by” any of a specific group (see screenshot).

I think this will give my any group that contains any new user. But acuually I just want any new group counted.

Is there a good way of doing that?


icon

Best answer by tsegalla 22 March 2023, 16:31

View original

2 replies

Userlevel 3
Badge +5

Hi @kornelius,

Great question!  You’re already on the right track.  To change this a bit, I’d recommend setting up the chart this way, using the “New” definition in place of “Any” in the user segmentation module:

The benefit of this is that the “New” definition on the right side would be globally applied to any event you choose on the left side; either “Any Event”, a more specific event, or multiple events.

To answer your specific question, this chart setup would give you the dates that a “new group” performed any event during the timeframe that they were “new” (aka the first time Amplitude received data associated with that group ID).

I hope this helps!

Badge +1

Hi, thank you for your question! To track new groups added in the "Accounts" add-on, you can create a chart with the "Account Created" event and group by the "Account ID" property. This will show you the number of new groups created over time. You can also add a filter to only show the "Account Created" event for the specific time period you're interested in. Hope this helps!

Some ref:
 

Reply