Hi all,
Why did the total number of events reduce when I include a user property into group by?
Has this got to do with the pruning that is being applied?
https://help.amplitude.com/hc/en-us/articles/360031259831
The user property is the company ID a user is tied to.
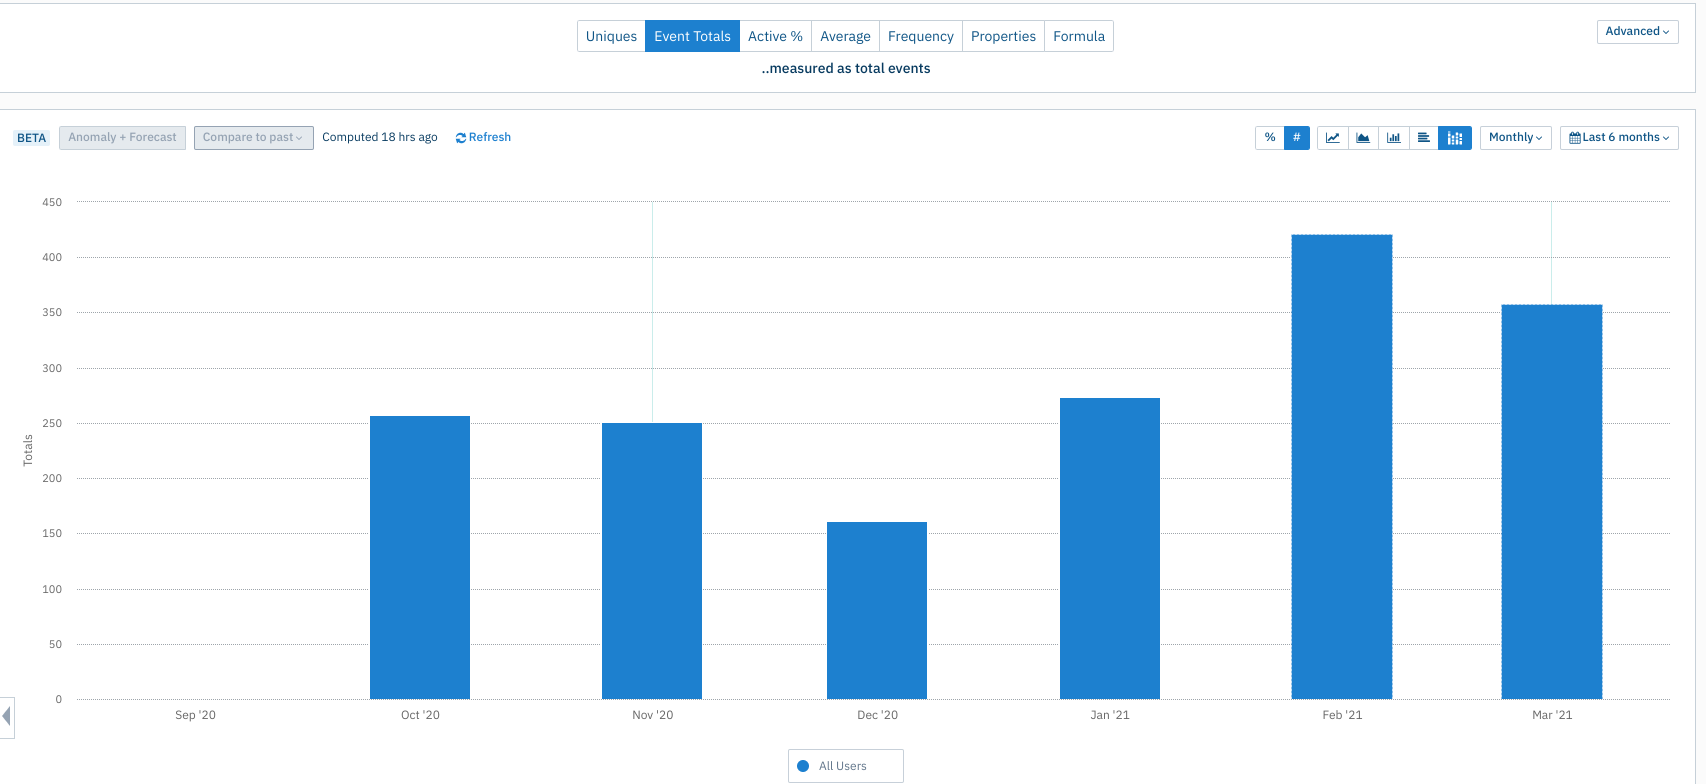
Below is before group by with a user property for a particular event, performed by any users.
For eg. there are 421 events in Feb 21

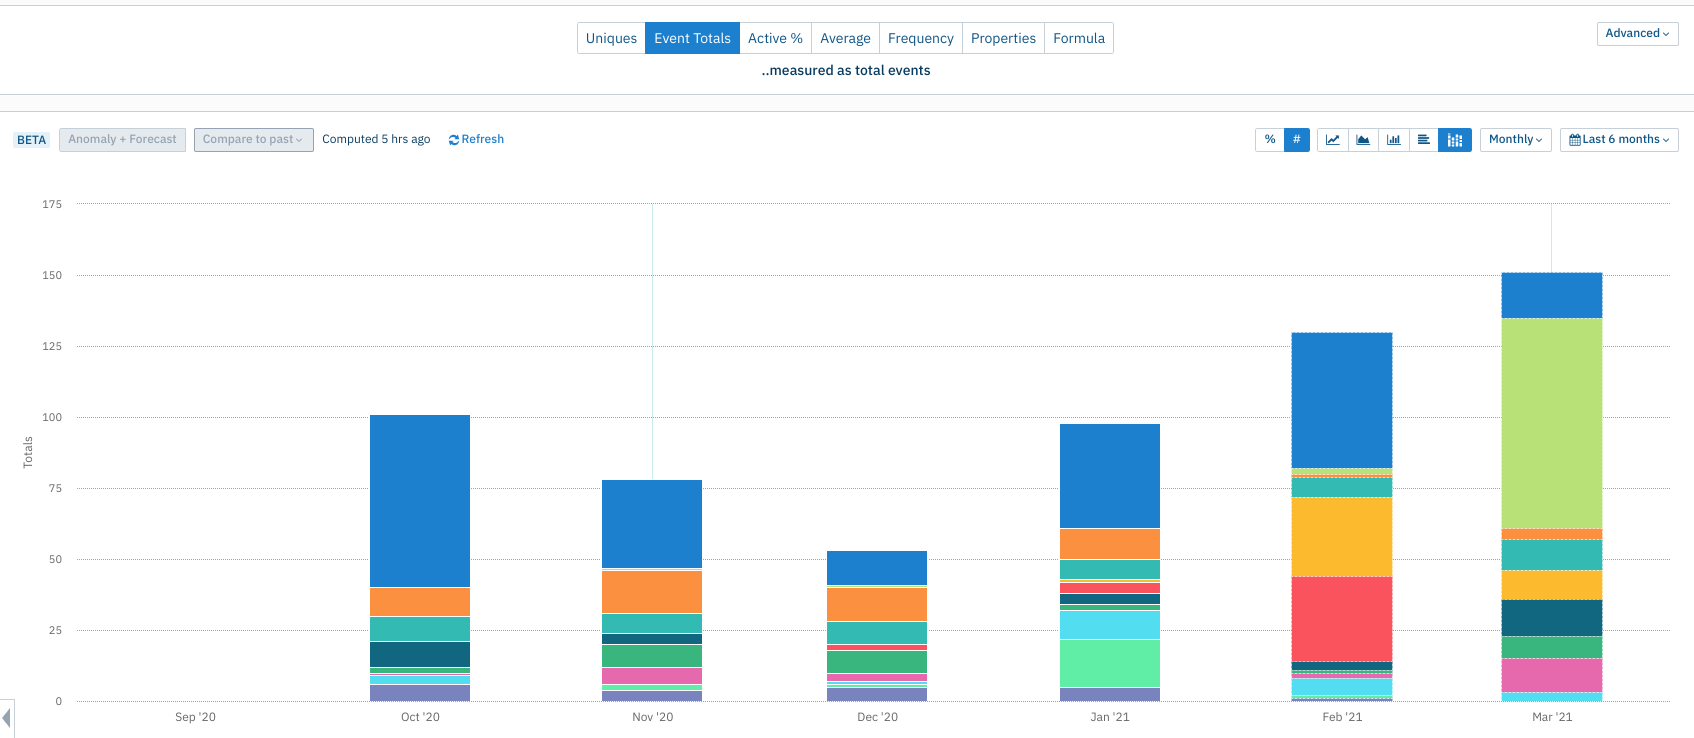
Below is after I add the company ID into the group by, for the same event, performed by any users.
Feb 21 now has 130 events.
It is possible that a user from a company ID, performs multiple events in the same month, but we are counting events here, so that should not be the reason, why it gets reduced.

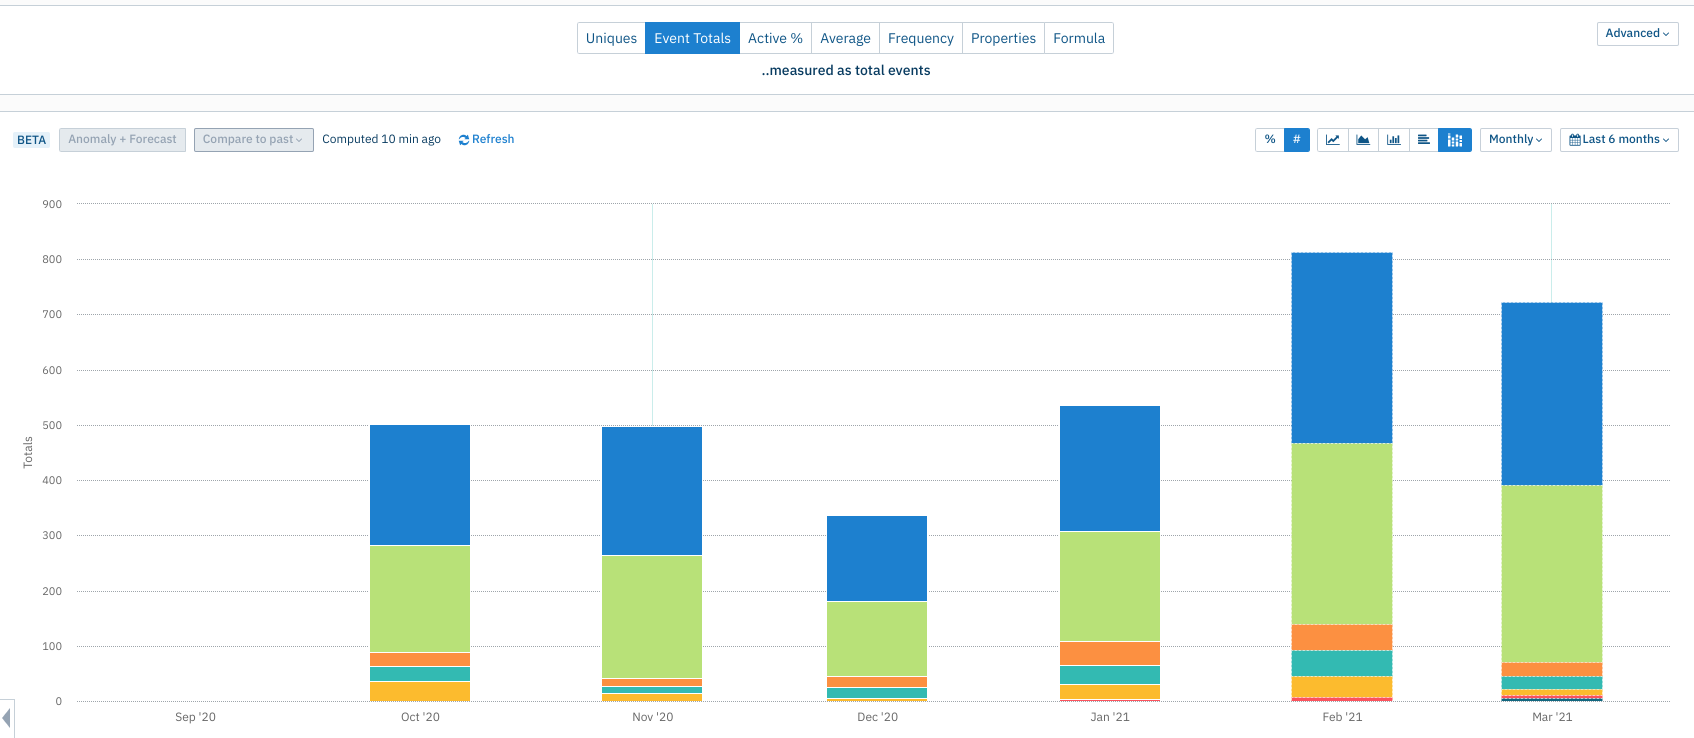
The opposite can happen if I group by a user property like ‘role’ in which the user can have multiple roles. Again for the same event, performed by any users. We can see Feb 21 total events went up to 813.

Is there a concept/principle on how amplitude groups the data, that I am missing?
Any ideas on how I can check the company ID user property to see what’s going on?